

Boost Your Returns: WACC
The missing half of the ROIC equation

Welcome to Part 2 of our educational series. In this series, we turn some of the most powerful investment concepts into simple, practical tools you can apply directly in your own analysis.
In the previous edition, we covered ROIC: one of the clearest ways to assess how efficiently a company uses capital. But a high return on capital only becomes truly meaningful once you also know what that capital costs the business. Only then can you judge whether a company is genuinely creating value for you as a shareholder.
That minimum required return is called the Weighted Average Cost of Capital, or WACC.
Dutch newsletter
Disclaimer
If you enjoy our publication, a like, comment, share and/or restack helps us enormously.
Before you continue, we recommend the following publications:


Part 1: The Essence of WACC
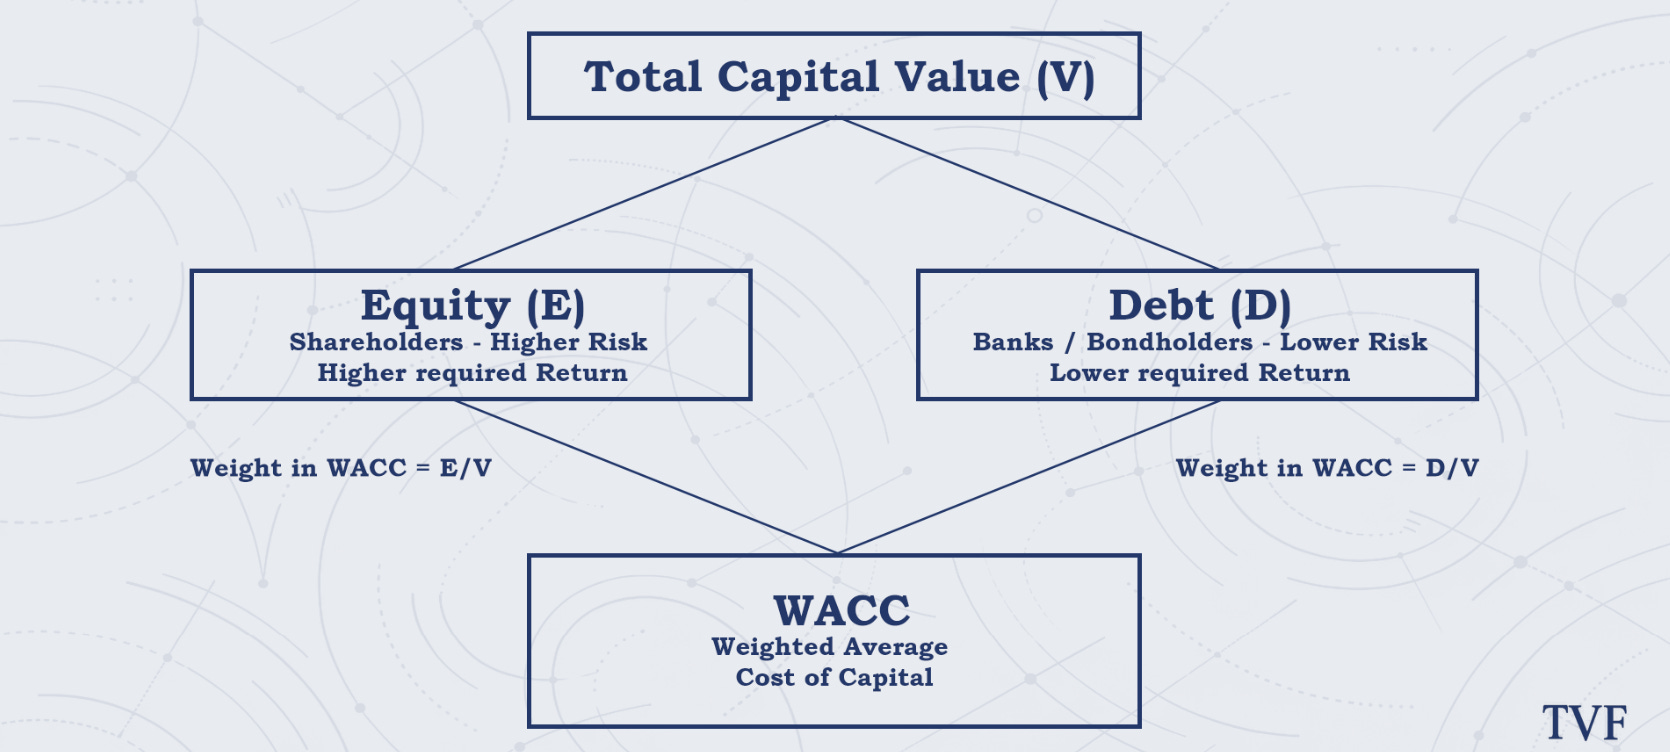
At its core, WACC is simply the average return a company must earn, at a minimum, to satisfy all of its capital providers.
Every company is financed through a mix of equity and debt. Equity comes from shareholders, who bear the greatest risk and therefore demand a higher return. Debt comes from banks and bondholders, who sit higher in the capital structure and are therefore usually willing to accept a lower return.
There is also a simpler way to think about it: when a business raises money to build factories, develop products, or enter new markets, that money is never free. Everyone who provides capital expects to be compensated. WACC is simply the average price of that capital.
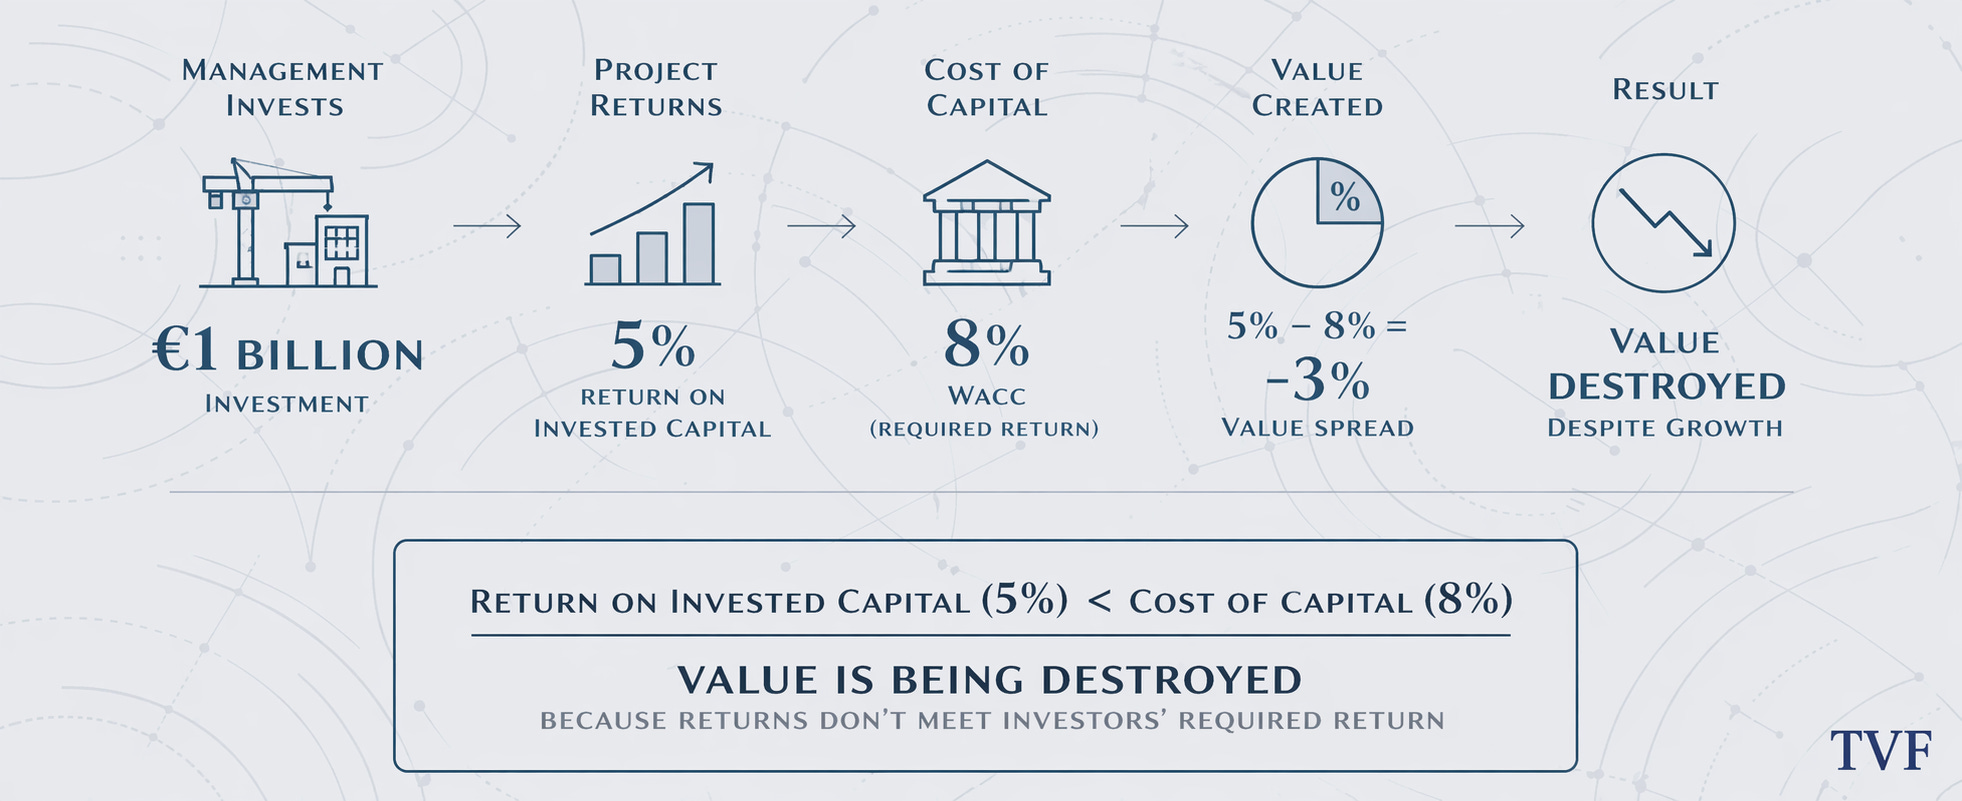
This matters because growth, by itself, tells you nothing about value creation. A company can get larger, generate more revenue, and even report profits, while still making poor decisions in economic terms.
Suppose a management team invests €1 billion in expansion and earns a 5% return on that capital. At first glance, that may not sound bad. But if the company’s true cost of capital is 8%, value is still being destroyed despite that growth. The company is earning less on the invested capital than investors and creditors are reasonably entitled to demand.
This is also where the crucial distinction between accounting profit and economic profit comes in. Accounting profit mainly asks whether a company earned more than it spent on operations. Economic profit goes a step further and asks whether a company earns more than its total cost of capital.
WACC bridges that gap. If a company earns more than its WACC, value is being created. If it earns less, value is being destroyed, even if reported profits look perfectly healthy on paper.
That is precisely why WACC matters so much. It forces investors to look beyond growth stories and earnings figures and focus on the underlying question: does this business generate a sufficient return to justify the capital employed?
Part 2: The Formula Behind WACC
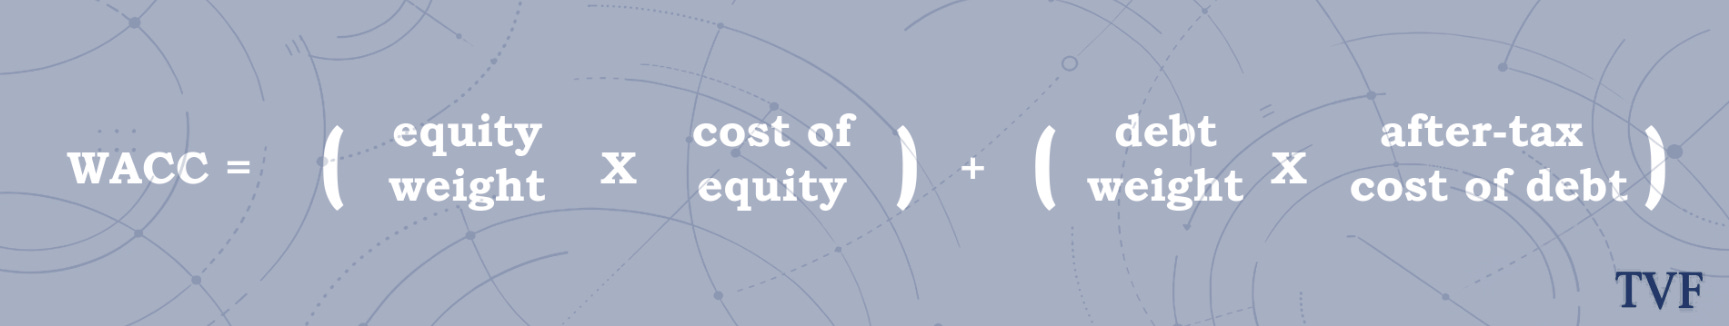
The formula sounds more technical than it really is:
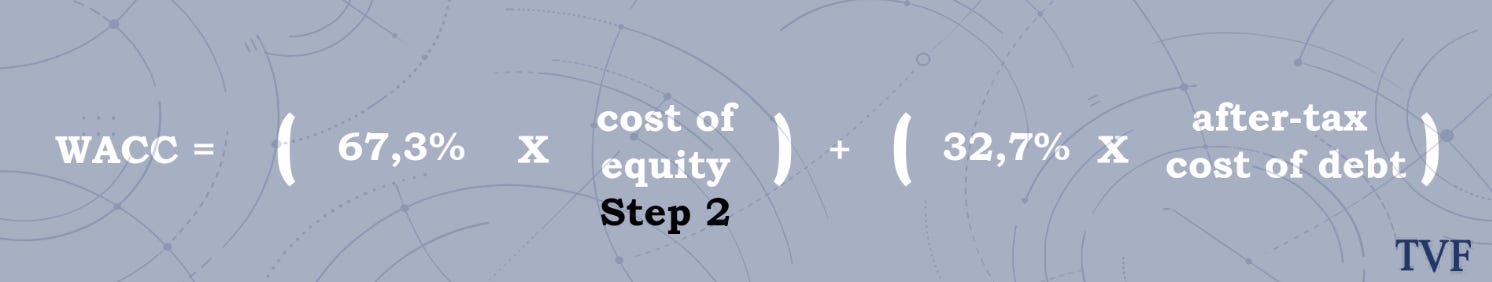
WACC = (weight of equity × cost of equity) + (weight of debt × after-tax cost of debt)
In plain English, that means:
we look at how much of the company is financed with equity
how much is financed with debt
what return shareholders require
what return creditors require
and then take the weighted average of those components
That weighted average is the WACC.
A company financed 70% with equity and 30% with debt will have a WACC that leans more heavily on the cost of equity. In a more leveraged business, the debt component plays a larger role. Still, more debt does not automatically mean a lower WACC. Cheap debt can reduce average capital costs, but excessive debt also increases risk, which in turn pushes shareholders to demand a higher return.
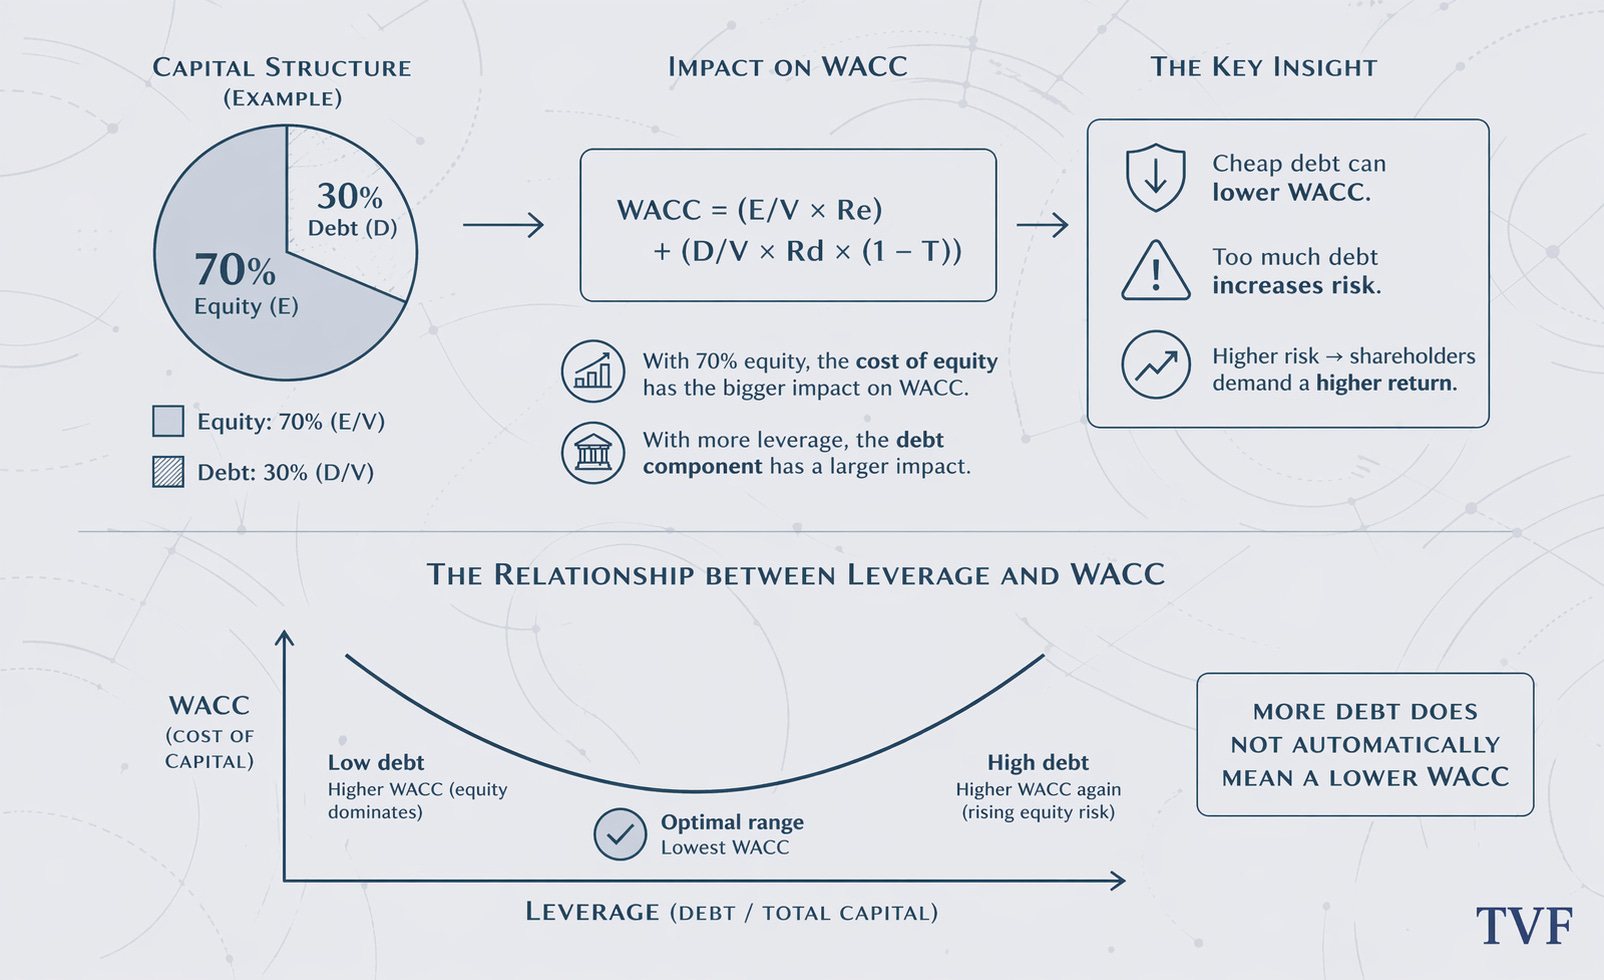
So the formula itself is straightforward, but the interpretation requires nuance. In the end, WACC is an estimate of what the market requires from that specific company.
Part 3: Calculating WACC Step by Step
Step 1: Determine the capital structure
You start with a simple question: what portion of the company is financed with equity, and what portion with debt?
For equity, you generally use market capitalization:
Market capitalization = share price × number of shares outstanding
For Heineken, we use the following example:
Heineken market capitalization = €68.40 × 555,806,000 = €39,430 million
Next, you determine total interest-bearing debt. You can find this on the balance sheet, usually by adding short-term and long-term borrowings together.
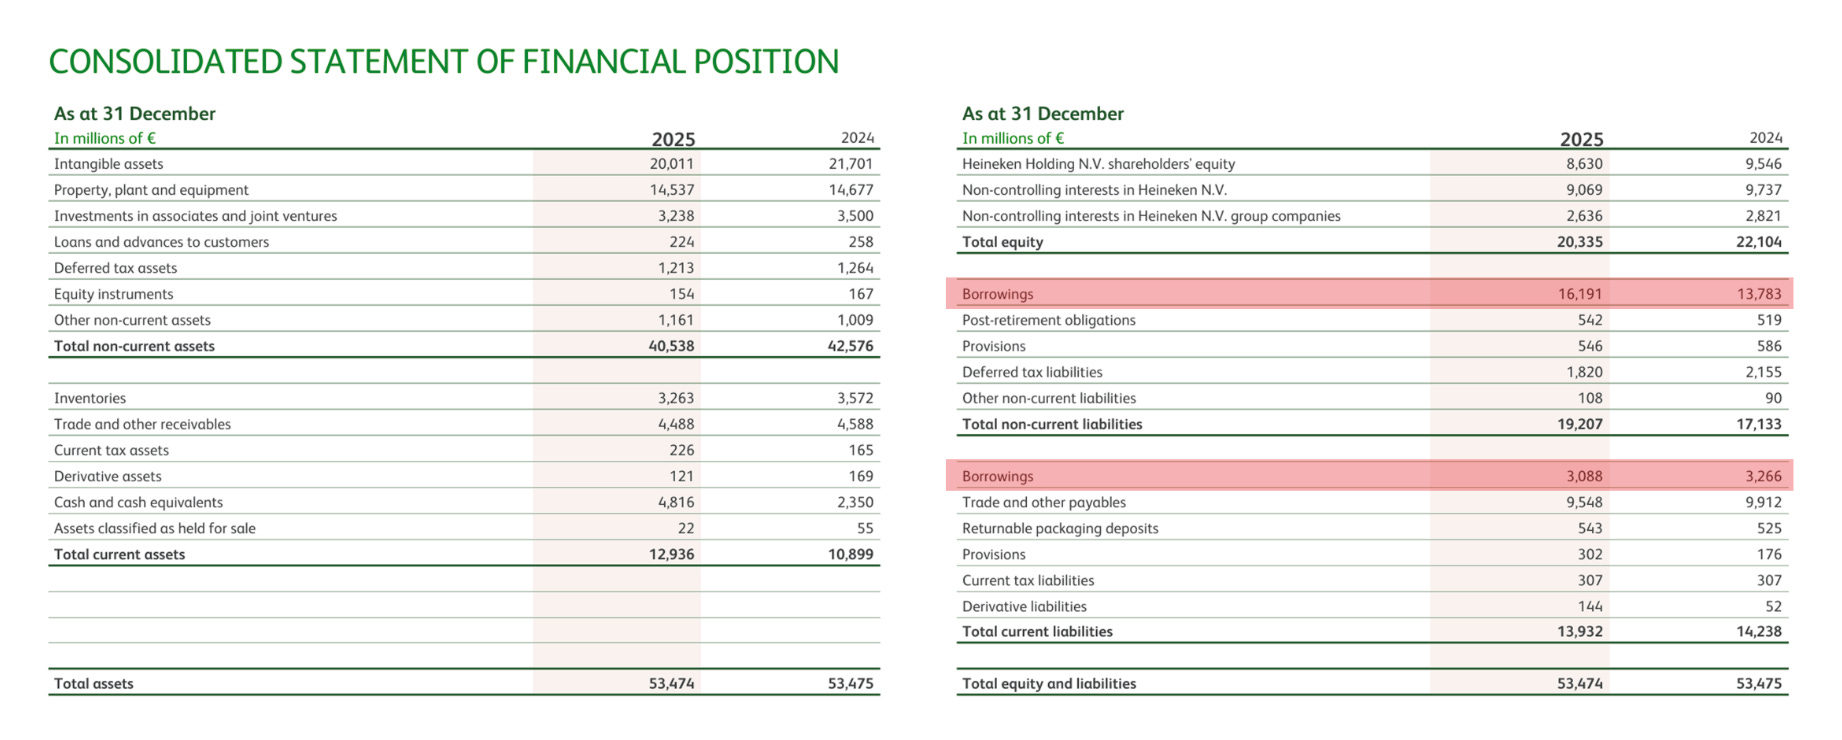
For Heineken:
Total interest-bearing debt = 16,191 + 3,088 = €19,279 million
You then calculate the weights:
Weight of equity = E / (E + D)
Weight of debt = D / (E + D)
Where:
E = market value of equity
D = interest-bearing debt
V = total capital value = E + D
For Heineken, this gives:
Weight of equity = 39,430 / (39,430 + 19,279) = 67.2%
Weight of debt = 19,279 / (39,430 + 19,279) = 32.8%
Step 2: Calculate the cost of equity
The cost of equity is the return shareholders require in order to own the stock. You cannot pull that number directly from the annual report. It has to be estimated.
The most widely used method for doing so is the Capital Asset Pricing Model, or CAPM:
Cost of equity = risk-free rate + beta × equity risk premium

So you need three inputs.
Step 2.1: The risk-free rate
In most cases, this is based on the yield on a 10-year government bond from the country or region that best matches the company and the valuation context.
In practice, many investors use:
for U.S. companies: the 10-year U.S. Treasury
for European companies: the 10-year German Bund
For Heineken, we use the 10-year German Bund: 3.04%.
Step 2.2: Beta
In textbook terms, beta measures how sensitively a stock has historically moved relative to the broader market.
Beta = 1.0 means the share price tends to move broadly in line with the market
Beta > 1.0 means the share price tends to move more than the market on average
Beta < 1.0 means the share price tends to move less than the market on average
Defensive businesses, such as utilities or producers of staple consumer goods, often have a lower beta. Cyclical businesses, highly leveraged companies, or more speculative stocks more often end up with a higher beta.
At the same time, beta is not a hard law of nature. The outcome depends on the data source used (Yahoo Finance for example), the period selected, the benchmark chosen, and whether you are looking at a raw or adjusted beta. As a result, different platforms can show different betas for the same company.
Personally, I would therefore not plug beta in blindly just because the textbook tells you to. Share price volatility does not automatically tell you everything about a company’s real risk profile. Factors such as cyclicality, leverage, the predictability of cash flows, and the quality of the business model often tell you more about risk than price movements alone. That is also much closer to the way an investor like Buffett would think about risk: not “how much does the share price move?”, but “how predictable, resilient, and understandable is the underlying business?”
Beta is therefore best viewed as a useful starting point, not as an untouchable truth. As you gain more experience, you become better able to judge whether a given beta makes sense or whether an adjustment would be more reasonable. If a defensive consumer staples business suddenly shows a beta of 1.8, that is usually a reason to question the figure, not to accept it uncritically.
For Heineken, we use a beta of 0.8.
Step 2.3: The equity risk premium
The equity risk premium is the additional return investors demand for holding equities over and above the risk-free rate. This premium differs by market.
For those who do not want to make things unnecessarily complicated, a reasonable rule of thumb is often:
5.0% for the U.S.
5.5% for Europe
For Heineken, we use an equity risk premium of 5.5%.
That gives us:
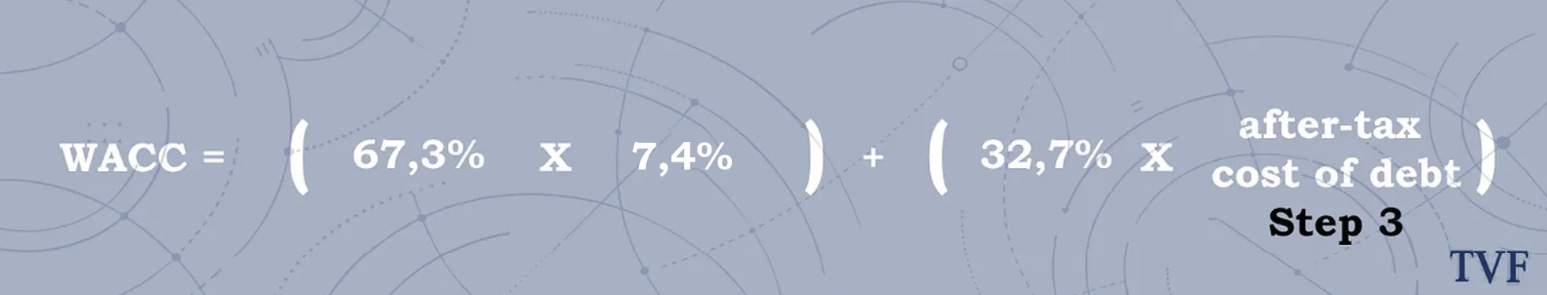
Cost of equity = 3.04% + 0.8 × 5.5% = 7.44%
Step 3: Calculate the cost of debt
The cost of debt is easier to estimate. It is essentially the interest rate the company pays on its borrowings.
You can usually estimate it as:
Interest expense / interest-bearing debt
For Heineken, we use:
Interest = €620 million
Debt = €19,279 million
So:
Cost of debt = 620 / 19,279 = 3.2%
Because interest is tax-deductible in many countries, WACC usually uses the after-tax cost of debt:
After-tax cost of debt = interest rate × (1 − tax rate)
As a rule of thumb, the tax rate can be estimated as:
Tax expense / profit before tax
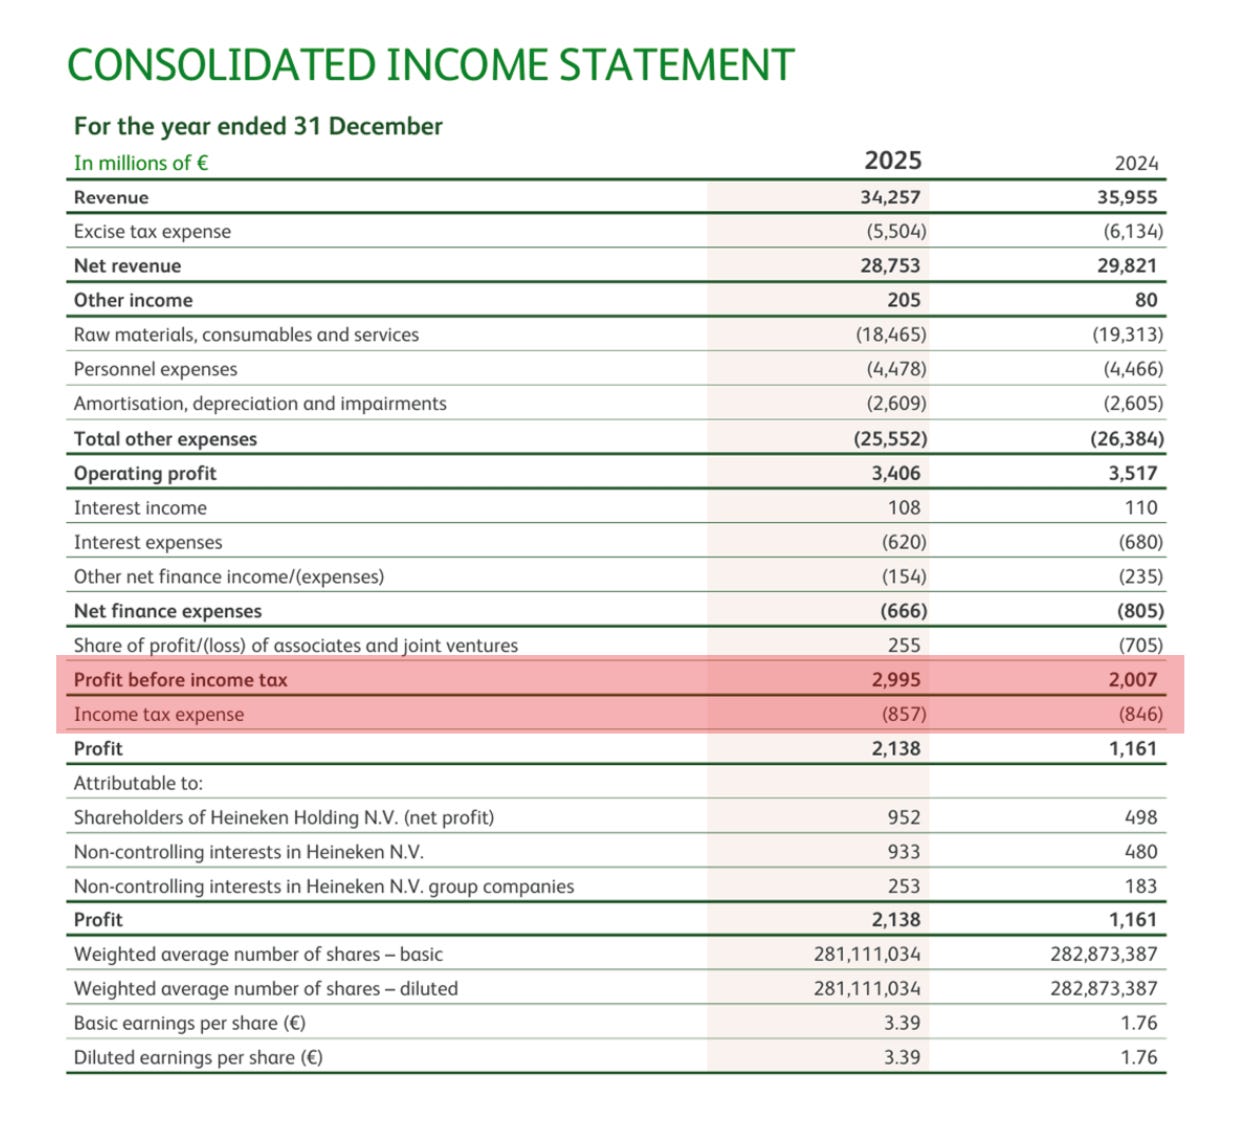
For Heineken:
Tax rate = 857 / 2,995 = 28.6%
So:
After-tax cost of debt = 3.2% × (1 − 28.6%) = 2.3%
Step 4: Plug everything into the formula
Now you combine all the building blocks:
Weight of equity = 67.2%
Weight of debt = 32.8%
Cost of equity = 7.44%
After-tax cost of debt = 2.3%
That gives:
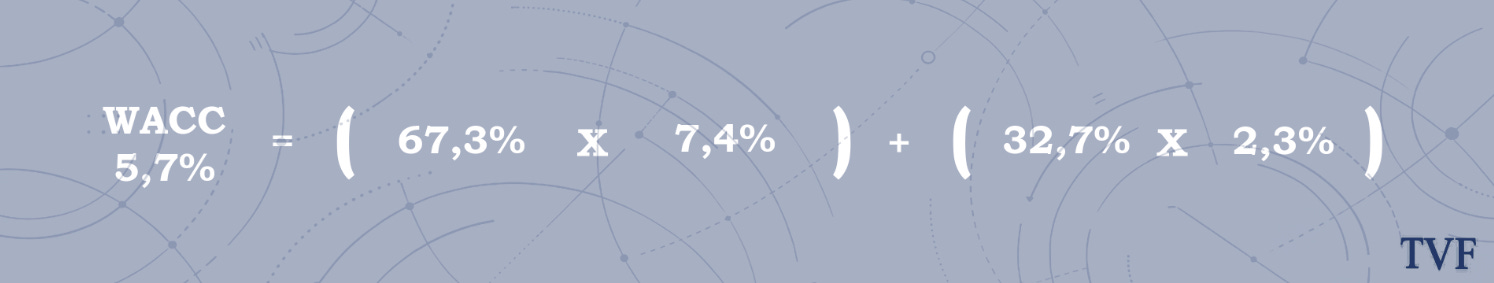
WACC = (67.2% × 7.44%) + (32.8% × 2.3%)
WACC = 4.98% + 0.75% = 5.7%
So in this simplified approach, Heineken’s WACC comes out at approximately 5.7%.
That means management must earn more than 5.7% on invested capital in order to create value. Anything below that means the company is not earning enough, in economic terms, on the capital it employs.
An important nuance
The WACC formula is simple. The estimate behind it is not.
Two investors can look at the same company and still arrive at slightly different WACCs, simply because they use different assumptions for beta, the equity risk premium, the capital structure, or the tax rate.
That is perfectly normal.
The purpose of WACC is not to produce a perfect number with false precision. The purpose is to establish a reasonable hurdle rate that helps you judge more clearly whether a company is using its capital productively.
Part 4: Where WACC Becomes Valuable
WACC is not just a technical formula. It is a practical analytical framework that matters in two important ways.
1. As the discount rate in a DCF
In a discounted cash flow model, you convert future cash flows into a present value. WACC is the rate used to discount those future cash flows based on the company’s risk profile and capital structure.
A higher WACC reduces value.
A lower WACC increases value.
That is exactly why DCF models are so sensitive to small changes in assumptions. The terminal value in particular reacts very strongly to changes in the discount rate. A difference of just one percentage point in WACC can therefore have a significant impact on your estimated fair value.
2. As the hurdle rate for capital allocation
This second use may be even more important.
WACC tells you the minimum return management must achieve before any value is created at all. It therefore gives you a benchmark for assessing investments, acquisitions, buybacks, and expansion plans.
If management allocates capital to projects that are likely to earn less than WACC, then growth stops being a positive. It simply becomes value destruction in a more attractive form.
That naturally brings you to the combination that matters most in practice: ROIC versus WACC.
On its own, WACC tells you what capital costs.
On its own, ROIC tells you what a company earns on that capital.
Together, they tell you whether a business is actually creating economic value.
The key concept here is the ROIC-WACC spread:
ROIC – WACC = economic spread
That spread shows whether a company:
creates value
barely covers its cost of capital
or structurally destroys value
A company with a ROIC of 14% and a WACC of 7% has a healthy spread of 7 percentage points. That is an attractive profile, especially if those returns are durable and the company still has room to reinvest at similarly high rates.
A company with a ROIC of 9% and a WACC of 8.5% may still be profitable, but the economic value creation is minimal. There is very little room for setbacks, capital misallocation, or strategic mistakes.
A company with a ROIC of 6% and a WACC of 9% may still be growing in size, but it is not growing in value. That is not a compounding machine, but a capital-consuming machine.
Bad: ROIC < WACC
Good: ROIC > WACC
That is why the combination of WACC and ROIC is so powerful. It helps you distinguish between companies that simply get bigger and companies that genuinely increase their intrinsic value.
Part 5: Practical Rules of Thumb
To make this framework immediately useful, it helps to keep a few simple rules of thumb in mind.
1. Look at the spread first, not just the absolute ROIC
A ROIC of 12% sounds strong until you discover that the company’s WACC is 11%. At that point, it becomes clear that the business is barely creating any value. Conversely, a more “boring” company with a ROIC of 10% and a WACC of 6% may be far more attractive economically.
2. Study the spread over time
One year tells you very little. It is far better to look at a period of five to ten years. Ask yourself whether ROIC is structurally above WACC, whether the spread is widening or narrowing, and whether the company is genuinely growing in value or merely in size.
3. Always compare within the sector
A software company and a steel company have completely different capital requirements and risk profiles. As a result, ROIC and WACC will often differ substantially as well. The point is not which company reports the highest ROIC in absolute terms, but which one creates the most value within its own economic context.
4. Growth is only good if the return on that growth is high enough
Revenue growth, acquisitions, and expansion are only valuable if the additional capital earns more than it costs. Growth below WACC is not value creation. It is value destruction.
5. Pay attention to reinvestment opportunities
A high spread is excellent, but it only becomes truly valuable when a company has sufficient opportunities to reinvest capital at attractive returns. A high ROIC without reinvestment opportunities produces a very different kind of business from a true compounder.
6. False precision is dangerous
It is better to work with a reasonable range than with a WACC of, say, exactly 8.37% as though it were an objective fact. WACC remains an estimate based on assumptions, not a law of nature.
Part 6: Pitfalls in Using WACC
Although WACC is a powerful tool, it should not be applied blindly.
In financials and insurers, the capital structure is fundamentally different, which makes traditional WACC analysis less useful.
In very young or loss-making businesses, WACC is often harder to apply in a meaningful way because returns on capital are not yet stable or representative.
In highly cyclical businesses, both ROIC and WACC can temporarily paint a distorted picture, for example around peaks or troughs in the cycle.
And finally, a neat spreadsheet does not make the outcome reliable. The quality of a WACC estimate depends entirely on the quality of the assumptions behind it.
Conclusion
WACC is more than a technical input in a DCF model. It is the minimum return hurdle a company must clear in order to create value.
Only when a business consistently earns a ROIC above its WACC does real economic value creation begin to emerge. And the larger and more durable that spread, the stronger the compounding profile.
That is why WACC matters so much. Not because it produces a perfect number, but because it forces you to ask the right question: does this business earn more on capital than that capital costs?
Author: Jeffrey Kieboom

The Valuation Framework (TVF) turns market and sector news into clear economic models and links those themes to company notes that translate insights into valuation.
This publication is for informational and educational purposes only and does not constitute investment advice, a recommendation, or an offer to buy or sell any security. It does not take into account your personal financial situation, objectives, or risk tolerance. Investing involves risk, including the risk of loss. Any scenarios, estimates, and forward-looking statements reflect judgment at the time of writing and may change without notice; outcomes may differ materially. The analysis is based on publicly available sources believed to be reliable, but accuracy, completeness, and timeliness are not guaranteed. References to companies, commodities, and markets are illustrative and not endorsements. I may hold positions in securities mentioned, and those positions may change at any time. Nothing in this publication is intended to encourage or facilitate the circumvention of sanctions or other applicable laws and regulations.
Note: I wrote this piece and conducted the research myself. AI was used for feedback/editing support and to generate some of the images.