

ONEOK — The Midstream-Machine
From integration to cash harvesting — dividends now, buybacks later.

Disclosure: This publication is for informational and educational purposes only and does not constitute investment advice or a recommendation to buy or sell any security.
I am currently not invested in ONEOK.
Click here for: Dutch Newsletter
ONEOK is moving from an acquisition and integration phase into a phase where the discussion revolves around one thing: how much free cash flow the company can harvest per share. The coming quarters make that testable through a few hard checkpoints (FCF, leverage, coverage, and capex discipline) — and that is exactly where the asymmetry lies.
CHAPTER 1 — Storytelling
Scene setting: the paradox of “nuisance”
In the early 1900s, Oklahoma was in the middle of an oil boom. Natural gas was not a product but a problem: when drillers hit gas, they vented or flared it to keep drilling for oil. At the same time, cities like Oklahoma City and Tulsa were growing rapidly and needed reliable energy for heat and light. The opportunity was obvious, but the market was locked by one missing link: infrastructure. Without pipelines, gas remained a “nuisance”; with pipelines, it became a utility. In that friction—waste at the source and scarcity at the point of use—the seed of ONEOK was planted: not as a producer, but as the builder of the bridge that turns molecules into value.
The business model: “wellhead-to-burner-tip”
In 1906, Flynn and Ames founded the Oklahoma Natural Gas Company with a simple but capital-intensive idea: turn a waste product into a utility by bringing it to the user. They did not bet on the next discovery; they invested in logistics and reliability of supply. The first pipeline corridor to Oklahoma City (1907) was both product and catalyst: it enabled offtake and thereby created the market it needed. From that point on, the model grew into an infrastructure network that sells reliability—built on assets (pipelines, storage, compression) that must continuously manage flow, not merely be constructed.

Why this is still relevant today
The core logic has not changed. ONEOK’s product is still not “energy”, but access: connecting producing regions to hubs, end markets, and export. Whoever controls the bridge owns the friction everyone else has to pass through. And just like back then, execution within rules and permitting is not a sideshow but a core competency. The scale is far larger today, but the mechanism is the same: turning friction and waste into predictable cash flows through infrastructure.
CHAPTER 2 — The midstream engine
The North American midstream sector is moving in 2024–2026 toward one dominant proposition: integrated infrastructure platforms instead of stand-alone assets. Midstream is therefore less a “pipes business” and more a wellhead-to-water logistics system: processing, moving, buffering, optimizing molecules, and ultimately directing them to industry or export. ONEOK accelerated that trend through the acquisitions of Magellan, EnLink, and Medallion, shifting in a short period from an NGL specialist to a broader infrastructure player.
The 2024–2026 sector regime: three forces
Consolidation + functional expansion
The winners are building platforms that combine multiple links (processing, fractionation, pipelines, storage, terminals). This increases optionality and reduces friction for customers, but makes execution (integration) more important than ever.
Structural demand for gas and liquids
Demand for natural gas is not only growing through traditional channels, but also receiving incremental support from LNG exports and new power/demand pockets (including data centers and industrial load). For midstream this means: infrastructure becomes strategic when constraints become visible and volumes are structurally “locked in.”
Capital discipline as the new benchmark
After years of “capex for capex,” the sector is being judged on cash flow, synergy realization, and balance-sheet discipline. ONEOK positions itself explicitly with synergy targets and a leverage anchor toward ~3.5x.
What really matters at ONEOK: three engines
ONEOK is best understood as three cash flow profiles under one roof:
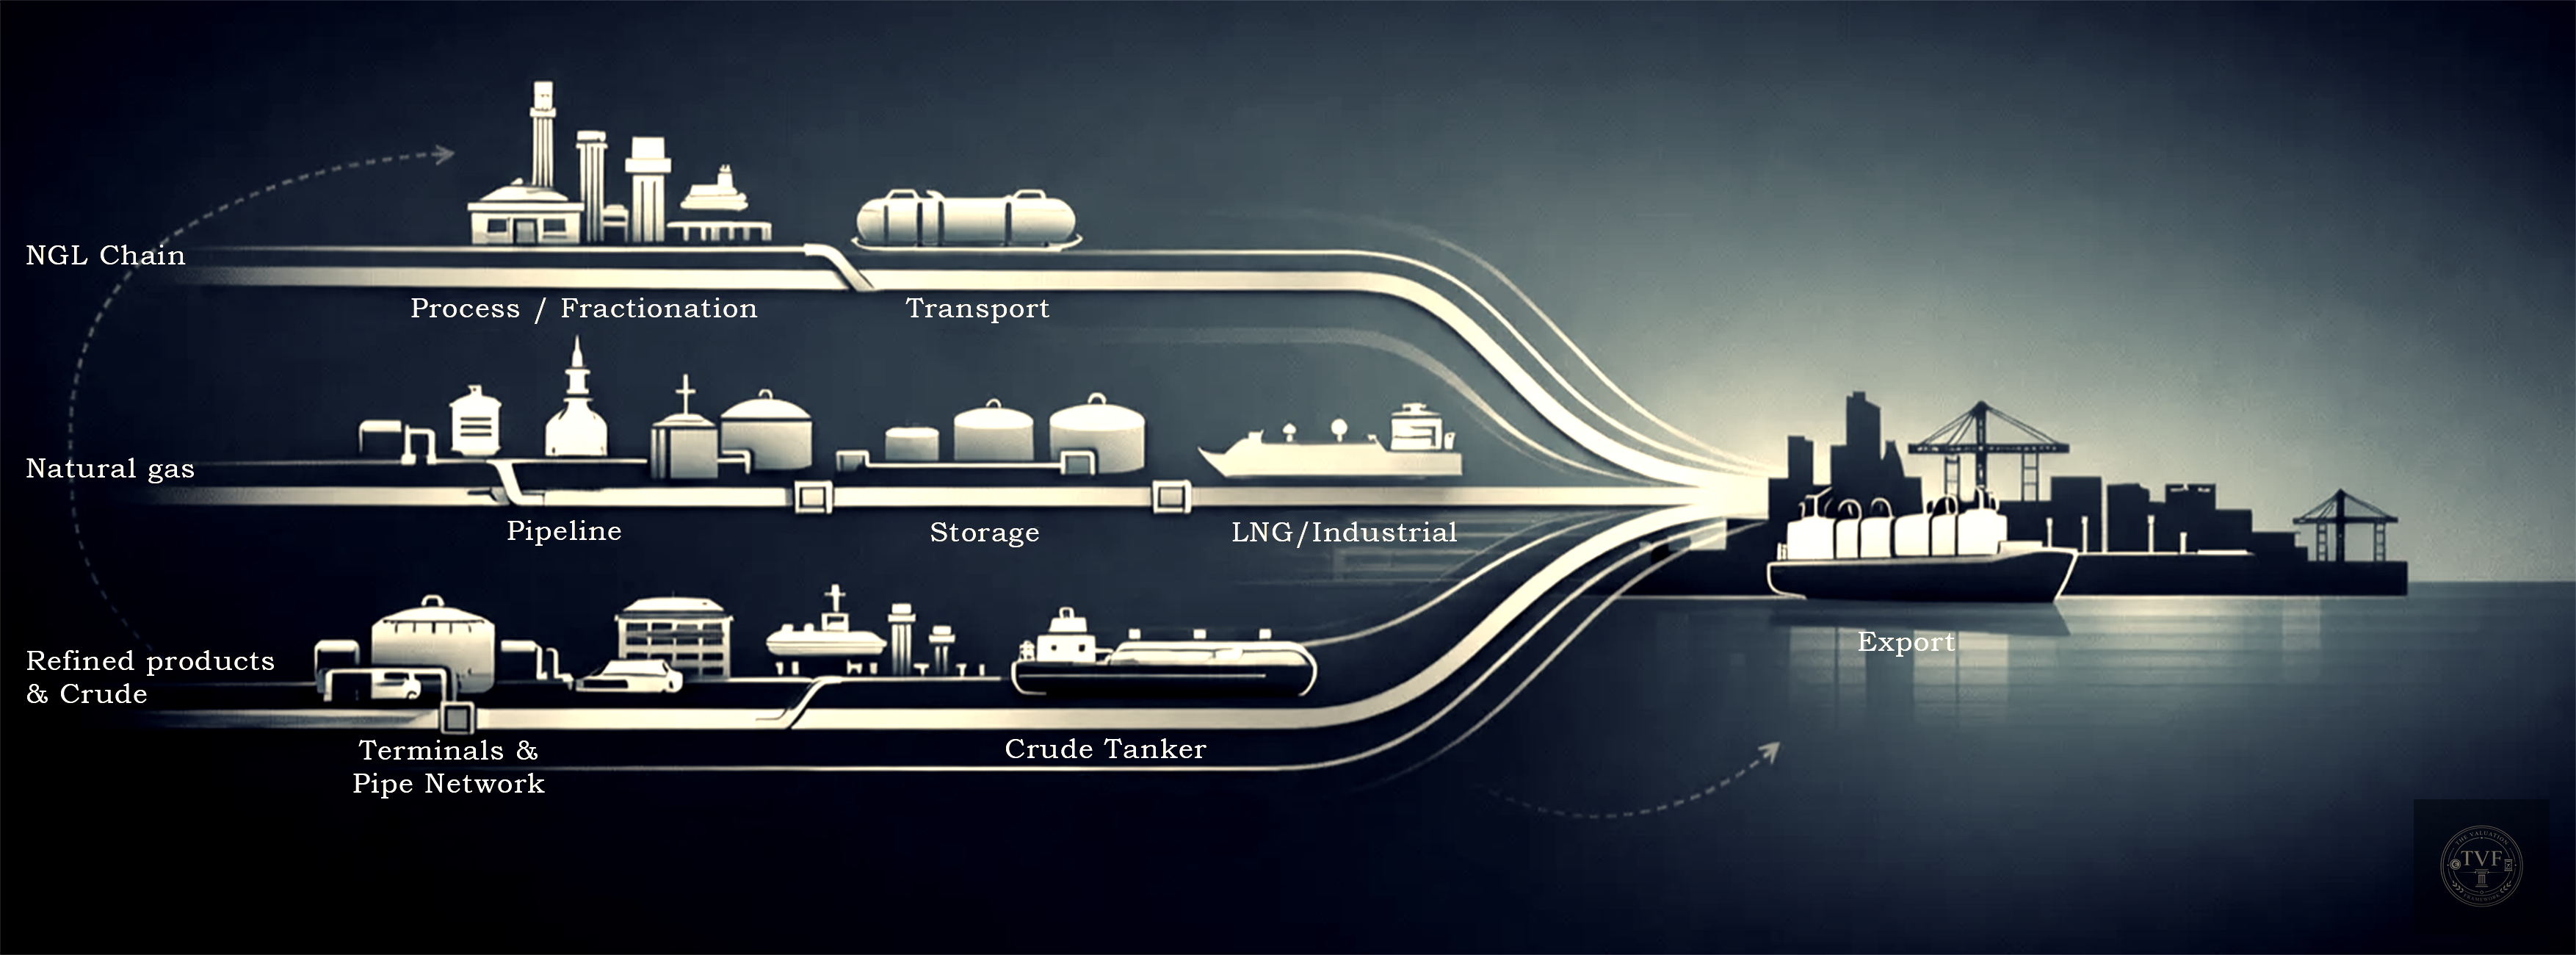
(1) NGL chain (growth + choke points)
This is the backbone. Growth is driven mainly by volumes, utilization, and hub economics—not by “betting on price.” This is also where the “capacity anchor” sits: fractionation/processing/hubs that function as choke points toward petrochemicals and export.
KPIs: raw feed throughput, fractionation utilization, and spreads that say something about hub economics (such as Conway–Mont Belvieu).
(2) Natural gas transport & storage (defensive cash flow)
This is the most defensive block because revenues largely come from capacity reservations and contract structures. The key point for readers: this segment primarily earns by keeping capacity available, not by trading.
KPIs: contracted capacity %, storage/throughput, and signals of structural demand (LNG/power/industrial).
(3) Refined products & crude (Magellan: “utility/logistics”)
With Magellan, a different type of midstream enters the mix: tariff- and volume-driven logistics with contract mechanics (including escalators) and relatively stable end demand.
KPIs: volumes shipped (MBbl/d) and tariff/mechanics (escalators).
Footprint & hubs: why geography does matter
The value of ONEOK’s footprint is not in “maps”, but in owning hubs and corridors that volume flows must pass through. That makes the model largely fee-based, but shifts risk to the core variable: volume/throughput.
The driver logic is simple: basin productivity → volumes → utilization → fee-based earnings → FCF → dividends/buybacks.
Where is the real risk?
ONEOK’s ~90% fee-based framing lowers price sensitivity, but it does not neutralize volume cycles. The primary risk is therefore not day-to-day price moves, but a multi-quarter cooling of activity/producer behavior in core regions. Pricing power shows up mainly indirectly: through scarce capacity, contract escalators, and the value of hubs/optionality.
CHAPTER 3 — The invisible fortress: MOAT and cyclicality
ONEOK’s moat is not brand or tech, but infrastructure. The advantage sits in three defensive layers that rarely coexist at scale in midstream.
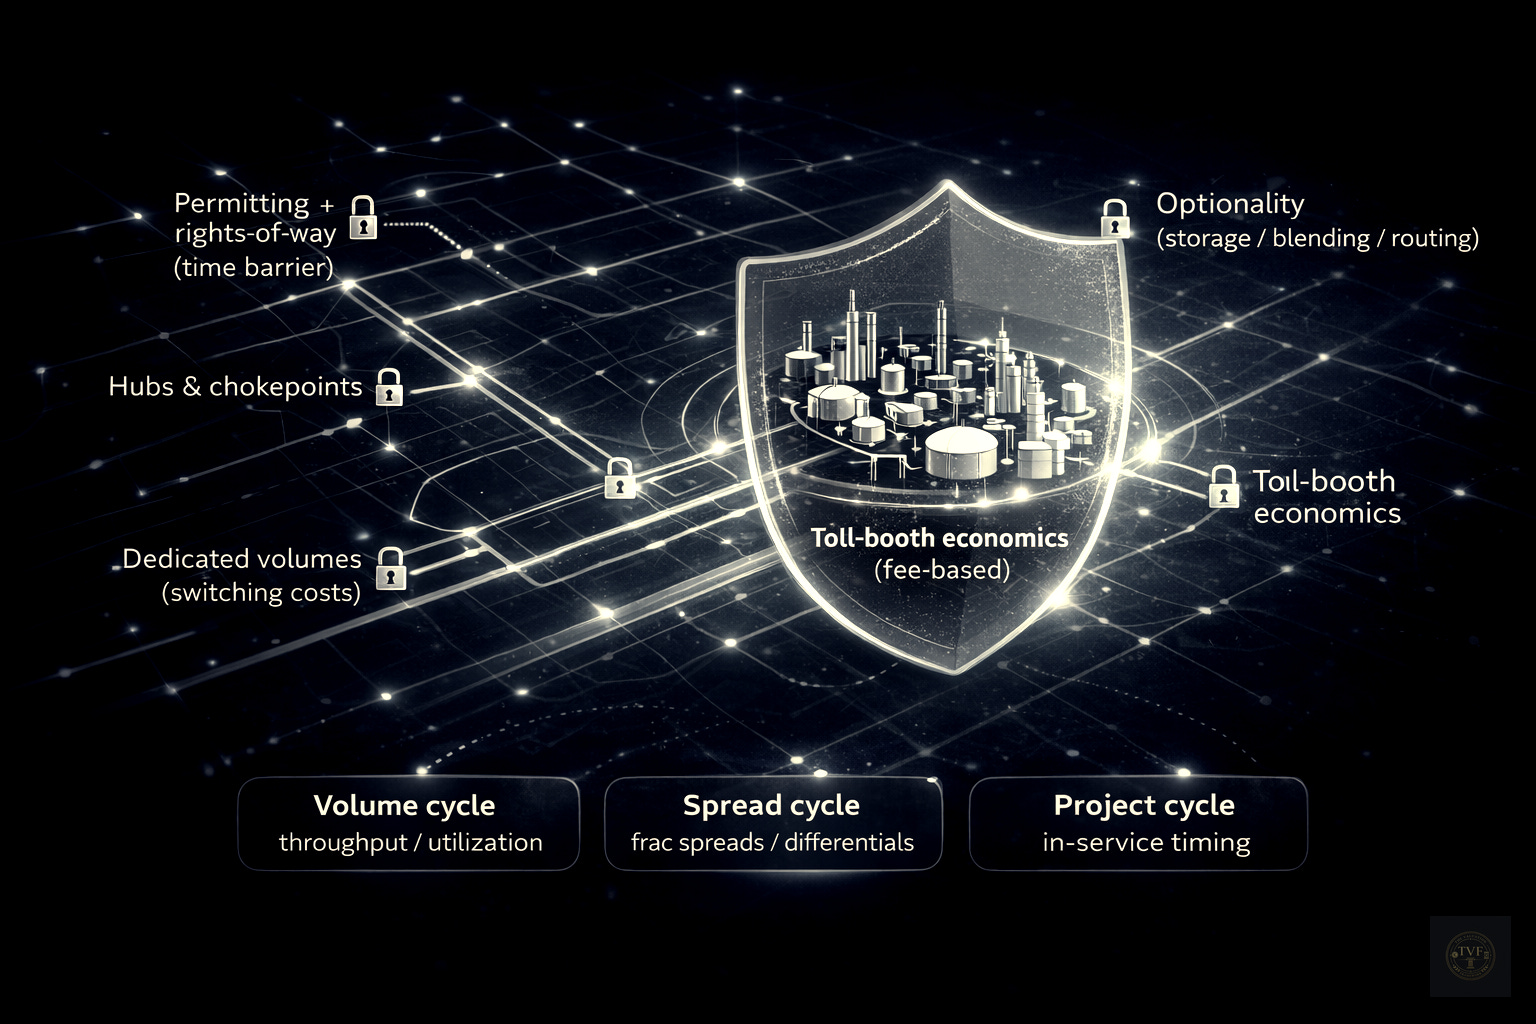
1) Physical moat: routes, time, and permission
Pipelines and terminals are theoretically “simple,” but practically scarce: right-of-way, permitting, local opposition, and multi-year timelines make duplication in mature corridors economically irrational. Competition therefore more often comes through pricing/contracting than through “a second pipe next to it.”
2) Hub moat: hubs create optionality
ONEOK owns hubs where flows converge (processing/fractionation/storage/terminals). Hubs increase commercial value because they can route, buffer, blend, or make molecules export-ready. In a world where export and industrial demand matter more, that optionality becomes a defensive mechanism: the network becomes more than the sum of its parts.
3) Contract moat: switching costs and embedded indexation
The strongest defensive layer emerges when supply is tied to the system both logistically and contractually (dedications, take-or-pay, long tenors). Switching imposes downtime, re-contracting risk, and often worse netbacks for producers. Pricing power is therefore uneven: regulated parts are limited, but in scarce hubs and contract structures with escalators the pricing mechanism remains defensible.
Cyclicality: defensive, but not acyclic
Midstream cycles are driven less by day-to-day prices and more by what moves through the system and when projects start generating cash.
Volume cycle (most important):
upstream activity → throughput/utilization → earnings
KPIs: throughput (NGL/gas), utilization, contracted capacity.Spread/commodity cycle (marginal but relevant):
NGL frac spreads & basis differentials affect processing/optimization
KPIs: NGL frac spread, hub differentials (e.g., Conway–Mont Belvieu).Capex/project cycle (multi-year):
build → in-service → cash flow ramp
The upside often sits in operating leverage: running existing infrastructure fuller and expanding with low marginal capex.
KPIs: project in-service timing, growth capex vs ramp.
CHAPTER 4 — DRIVER MAP
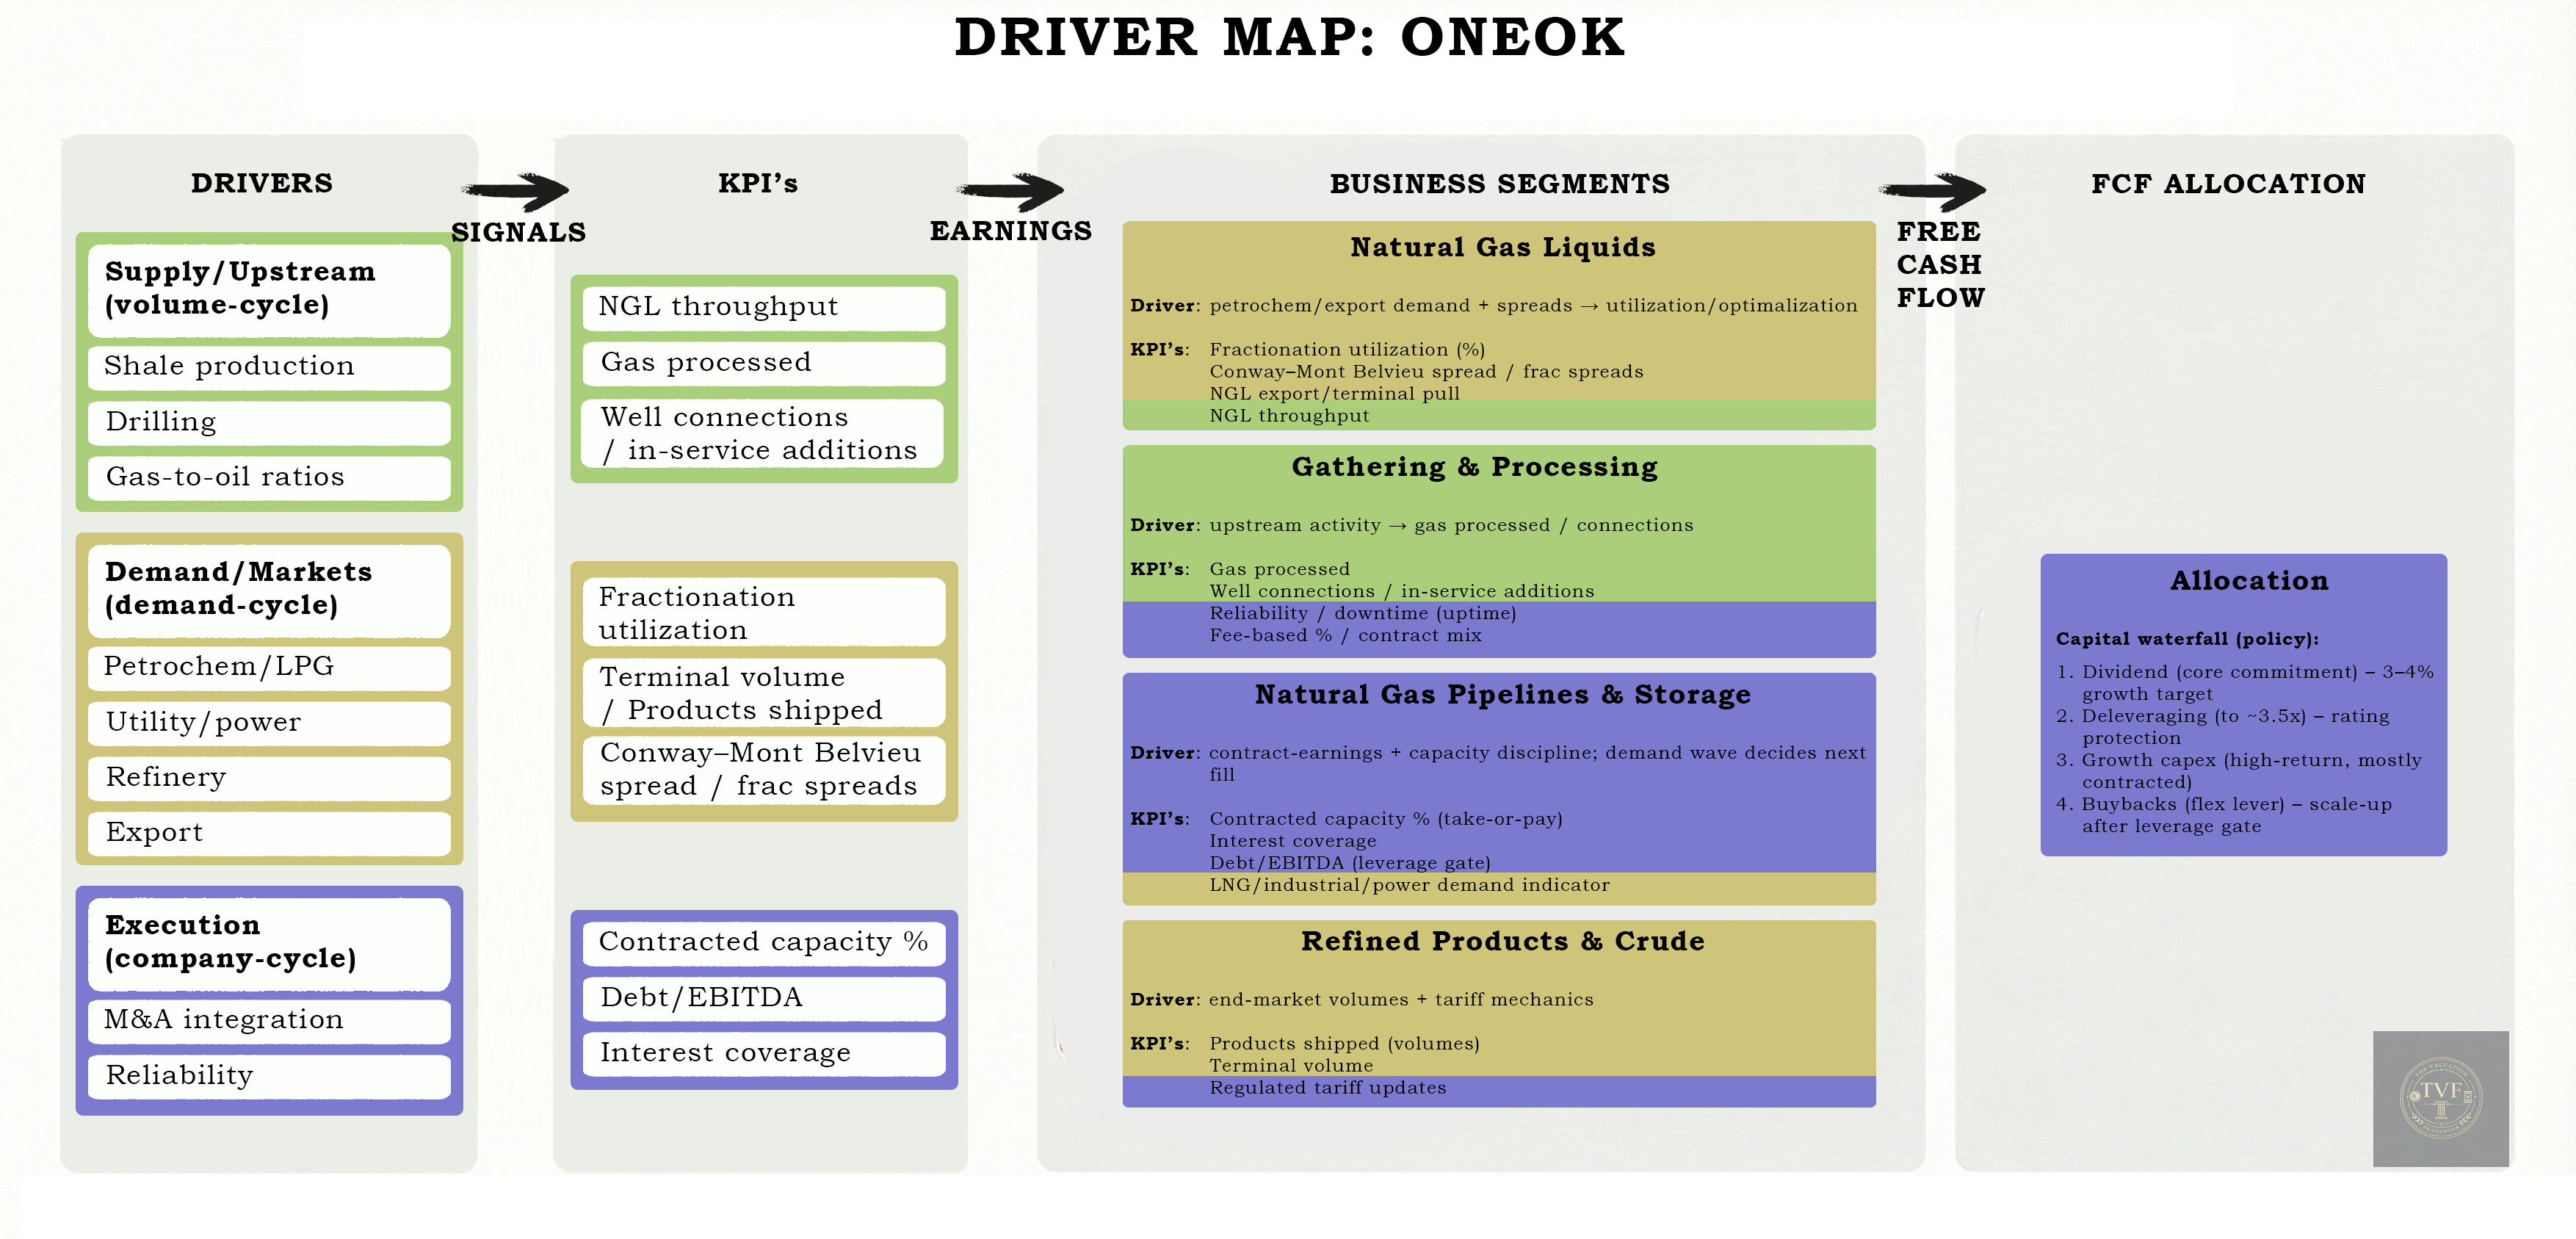
How to read the Driver Map
See this map as one chain from source to shareholder. Read it from left to right:
Drivers (macro/sector): external forces that determine how much volume enters the system (shale activity, petrochem/LPG demand, power/utility demand, refinery/export flows, and the pace of M&A integration).
KPIs (dashboard): the first checkpoints where you see those drivers show up (throughput & utilization in NGL, gas processed/well connects, contracted capacity, products shipped/terminal volumes, and synergy capture).
Segments (earnings engines): where ONEOK makes its money: NGL (growth/hubs), Gas transport & storage / G&P (more defensive, contract-driven), Refined products & crude (Magellan: logistics/utility profile).
Financial (outcome): everything converges in FCF — cash after capex/interest/taxes, divided by the number of shares (so including dilution or buybacks). Allocation then follows: dividends, deleveraging, and only after that buybacks at scale.
CHAPTER 5 — Financial foundation & multiples (2023–2031)
From revenue to free cash flow
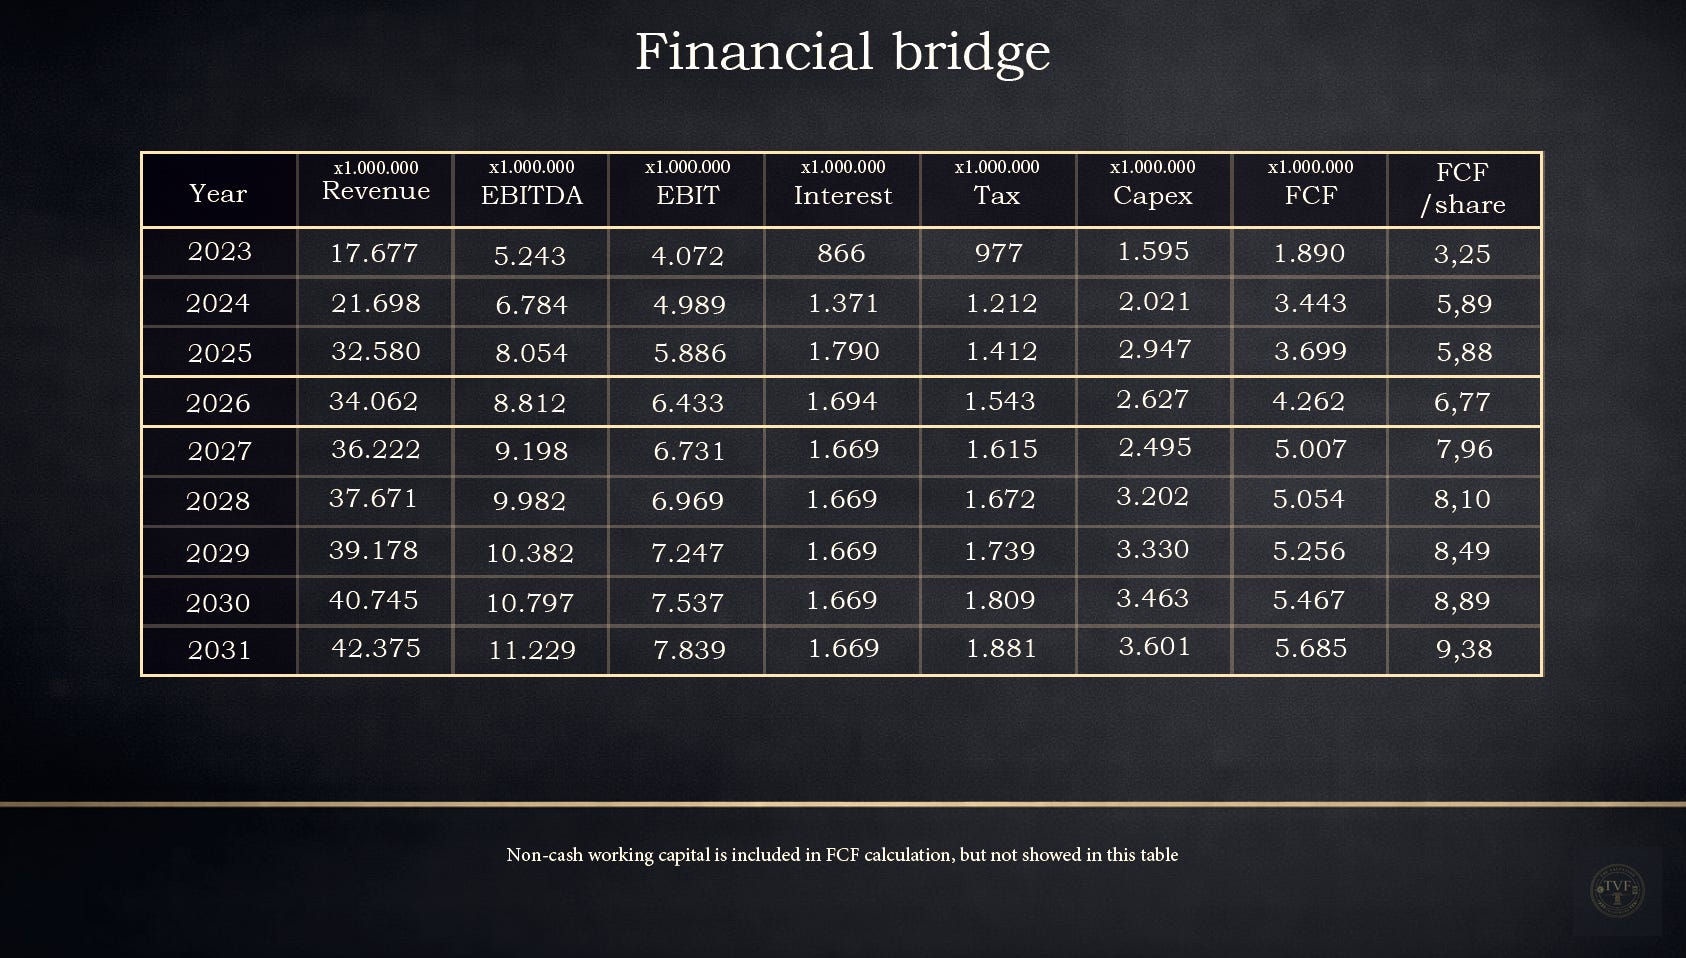
The Financial Bridge (2023–2031) summarizes ONEOK’s core story: after Magellan/EnLink/Medallion, the company is no longer a specialist in one link, but a broader wellhead-to-water midstream platform. The question this table answers is simple: does that increase in scale translate into structurally higher free cash flow (and thus earning power), or does it remain mostly “bigger on paper” with higher complexity and financing burdens?
The development in the model is deliberately built in two phases. 2024–2025 are transformation years: revenue growth of +22.75% (2024) and +50.15% (2025) reflects consolidation of acquired assets, volume growth across a broader network, and initial synergy/optimization effects. From 2026 onward, the bridge becomes increasingly assumption-driven and growth normalizes to a mature midstream profile: +4.55% (2026), +6.34% (2027), and then +4% per year (2028–2031). That 4% is explicitly meant as a “steady-state” pace: in the out-years, growth comes mainly from utilization, contract escalators, and export/hub optimization—not from new mega-deals.
The second key assumption is that the integration phase does not keep dragging on margins or investment intensity indefinitely. In the bridge you see an integration dip and then stabilization: after a relatively strong margin in 2024, 2025 is modeled more conservatively, after which the model normalizes to a stable EBITDA margin of ~26.5% from 2028 onward. The same applies to investments: capex is normalized in the out-years to 8.5% of revenue. This assumes that after the build and integration phase, ONEOK mainly runs as an infrastructure platform with maintenance plus selective debottlenecking, where incremental volumes can be handled relatively capital-efficiently.
The most practical “owner check” from the table is not EBITDA, but the cash return on enterprise value: the FCF yield rises in the model from 4.6% (2023) to 5.9% (2024) and 7.5% (2025), peaks around 8.6% (2026), and then normalizes to ~8.1% (2027–2031). That is the core claim: if integration succeeds and the platform does indeed reach a steady state, then in the years after the deal wave ONEOK should show a stably high cash earning power—financially underpinning the story of defensiveness (dividends) and later shareholder returns (buybacks).
From free cash flow to the shareholder
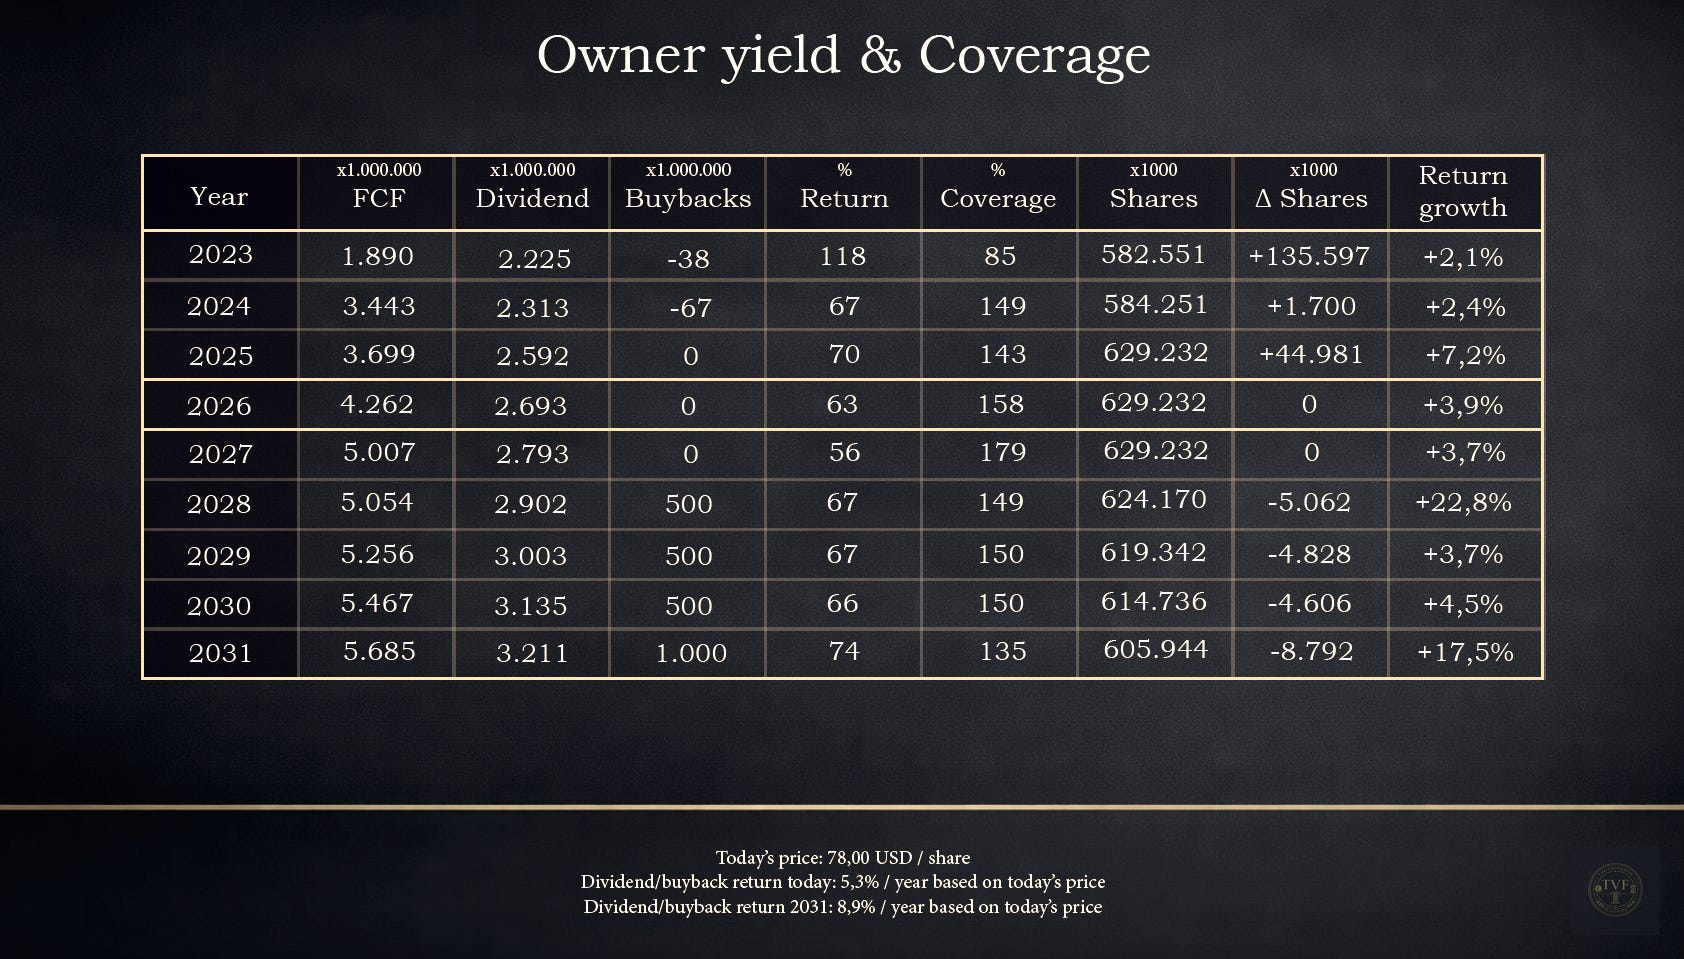
The “Owner yield & Coverage” table translates the output of the Financial Bridge into the question that matters to investors: how much cash reaches the shareholder each year, and how safe is that policy? In this analysis, FCF is the free cash flow as used in the DCF. The ‘Return’ column shows total shareholder return as a percentage of FCF (dividends + buybacks), while Coverage shows the margin of safety: FCF / dividends.
The pattern is clear: stability first, then per-share acceleration. In 2023, distributions still exceed free cash flow (payout >100%), but from 2024 onward the picture flips. FCF grows faster than the dividend and coverage moves to comfortable levels: coverage rises from 1.49x (2024) to 1.43x (2025), 1.58x (2026), and 1.79x (2027). This directly ties into the assumptions of previous table: after the transformation years, growth, margins, and capex intensity normalize, making cash flow structurally “owner-worthy.”
The table also shows why buybacks only become truly relevant later. ONEOK’s capital allocation is driven first by credit discipline: the leverage anchor of ~3.5x Debt/EBITDA is only reached in this path around 2027. Until then, the dividend is the fixed pillar and buyback capacity remains limited. From 2028 onward, the mix changes visibly: buybacks return as a second return engine ($500 million per year, rising to $1.0 billion in 2031), and the share count begins to decline. Where 2025 still shows a clear increase in shares (+44.981 million), it flips from 2028 onward into net reduction (-5.062 million in 2028, rising to -8.792 million in 2031). This is the mechanism by which earlier M&A dilution is gradually reversed and per-share outcomes accelerate.
Dividend safety remains the core check. On an FCF basis, the dividend remains covered from 2024 onward with a buffer, while the total payout ratio (dividends + buybacks) stays within a defensible range in the later years (roughly ~56–74% in 2027–2031). That leaves room for balance-sheet management, projects, and volatility.
Stress test (simple): FCF -20%. If free cash flow is temporarily 20% lower, the dividend is still covered in this setup: coverage would fall to roughly 1.19x (2024), 1.14x (2025), 1.27x (2026), 1.44x (2027), and 1.08x (2031). The implication matters: in a stress year, buybacks are the logical “shock absorber” (the variable lever), while dividends and balance-sheet discipline can remain intact.
What must be true to justify this path:
The normalization assumptions from the ‘Financial bridge’ table (growth/margins/capex) must translate into structurally higher FCF; otherwise coverage falls and buyback capacity shifts out.
Leverage must move toward ~3.5x; otherwise the return mix is forced to become more defensive.
Buybacks must remain opportunistic: in stress they should be reduced, not forced at the expense of the balance sheet or dividend.
Balance sheet & risk
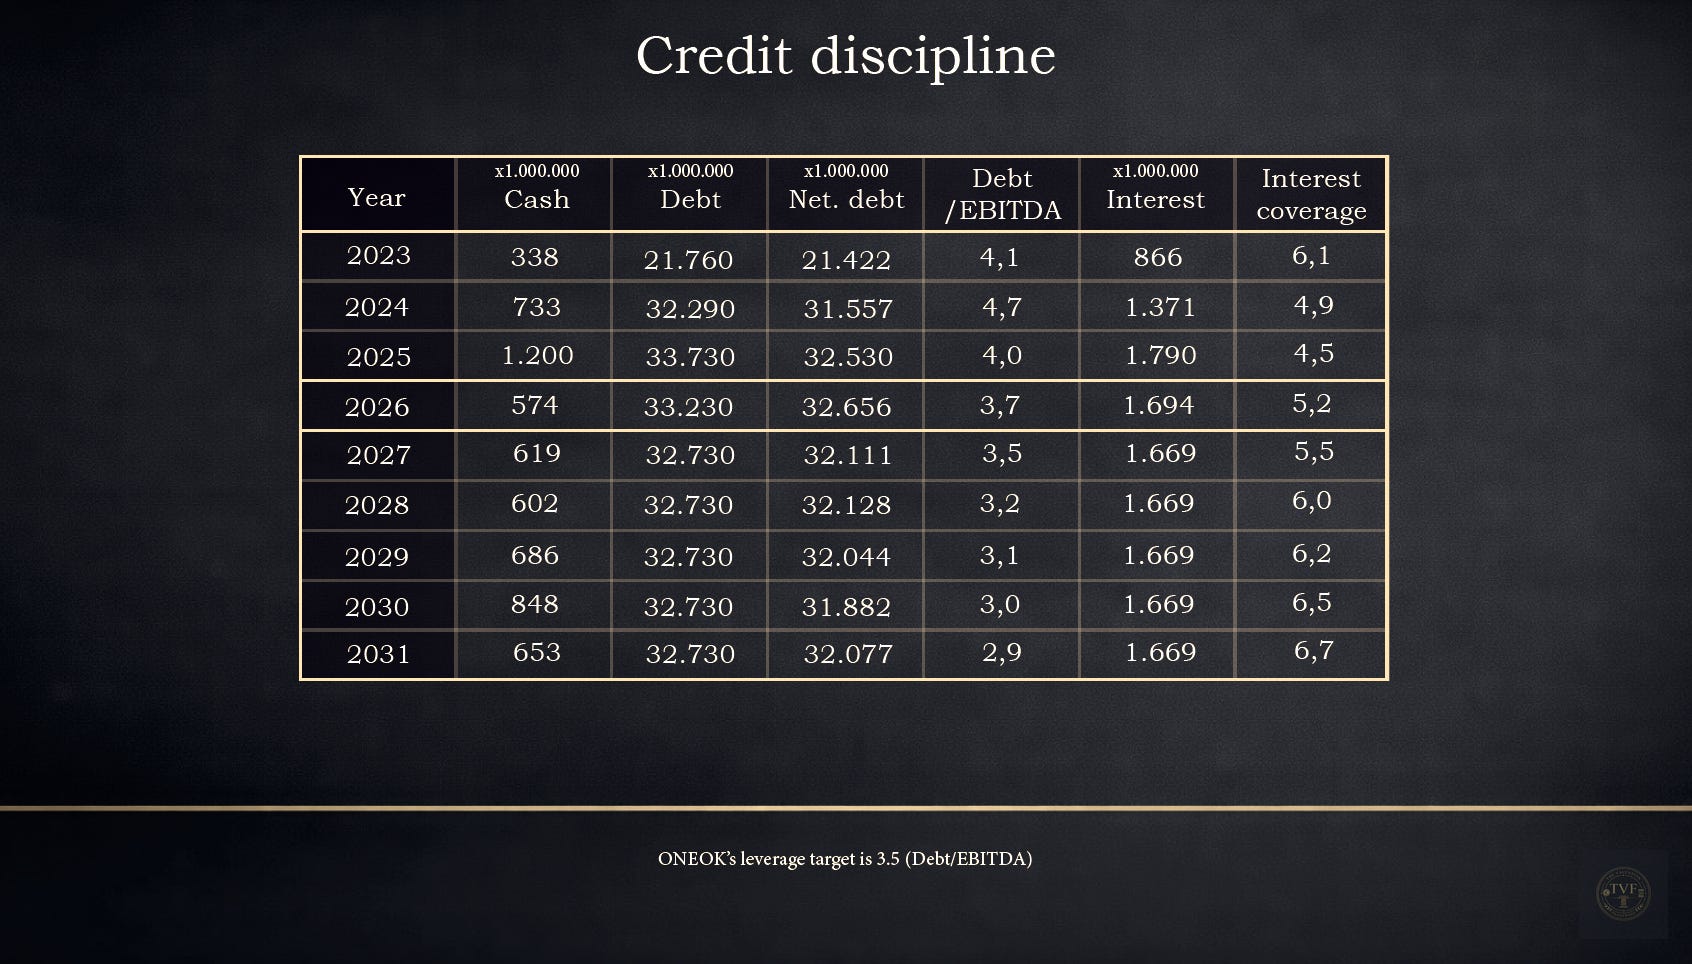
Post-acquisition, ONEOK has deliberately made the balance sheet “heavier” to integrate Magellan and EnLink/Medallion. That shows up in the leverage peak in 2024. The core question for this chapter is therefore not whether ONEOK can carry leverage (midstream can), but whether the deleveraging path is credible and remains affordable.
The “Credit Discipline” table shows that mechanism precisely: leverage declines not only through debt paydown, but mainly through EBITDA growth and synergy realization. In the base case, the Debt/EBITDA ratio moves toward the management anchor (3.5x), while interest coverage (EBITDA/interest) gradually improves. That coverage is the practical margin of safety: the higher the coverage, the more room remains for dividend growth and (later) buybacks without the balance sheet “locking up” again.
The most important focus point sits around the 2026–2029 maturity peak. In 2026, a large block of debt matures; that is not necessarily dangerous, but it makes the price of capital relevant again. ONEOK operates with investment-grade ratings and itself notes that ratings (and thus funding costs) are strongly linked to leverage, interest coverage, and the broader credit profile. In the event of a downgrade, funding costs could rise and access to short-term funding could become more difficult, making revolver/back-up facilities more important.
What follows for shareholders: buybacks are only truly scalable if deleveraging stays on track. If leverage remains higher for longer or refinancing becomes more expensive, the priority automatically shifts back toward balance-sheet protection.
Quarterly “risk checks” to monitor this path:
Net leverage trend: does Debt/EBITDA visibly move toward ~3.5x, or does the path stall?
Interest coverage: does coverage remain robust (no trend break due to higher rates or lower EBITDA)?
2026 refinancing signals: new debt issuance, tender offers, or refinancing commentary in earnings calls (price and timing).
Synergy evidence: is the “synergy run-rate” backed up concretely in quarterly updates (not just a target, but progress)?
Liquidity buffer: is there sufficient headroom in cash/revolver to bridge peak years in maturities smoothly?
CHAPTER 6 — Valuation
In the previous chapters, the foundation was laid: what ONEOK is, why it can keep generating cash, and what credit discipline is required for that cash to ultimately reach the shareholder. Chapter 6 translates that story into one question: what is ONEOK worth if we discount future free cash flows back to today?
FCF per share: FCF/share grows from $5.88 (2025E) to $9.38 (2031E).
Risk: leverage moves toward ~3.5x in 2027 and interest coverage remains >4.5x (rising to ~6.7x).
Return of capital (owner yield): the dividend grows 3–4% per year; buybacks accelerate only after deleveraging, lifting owner yield from ~5.3% today to ~8.9% in 2031 (based on the current price).
Valuation overview
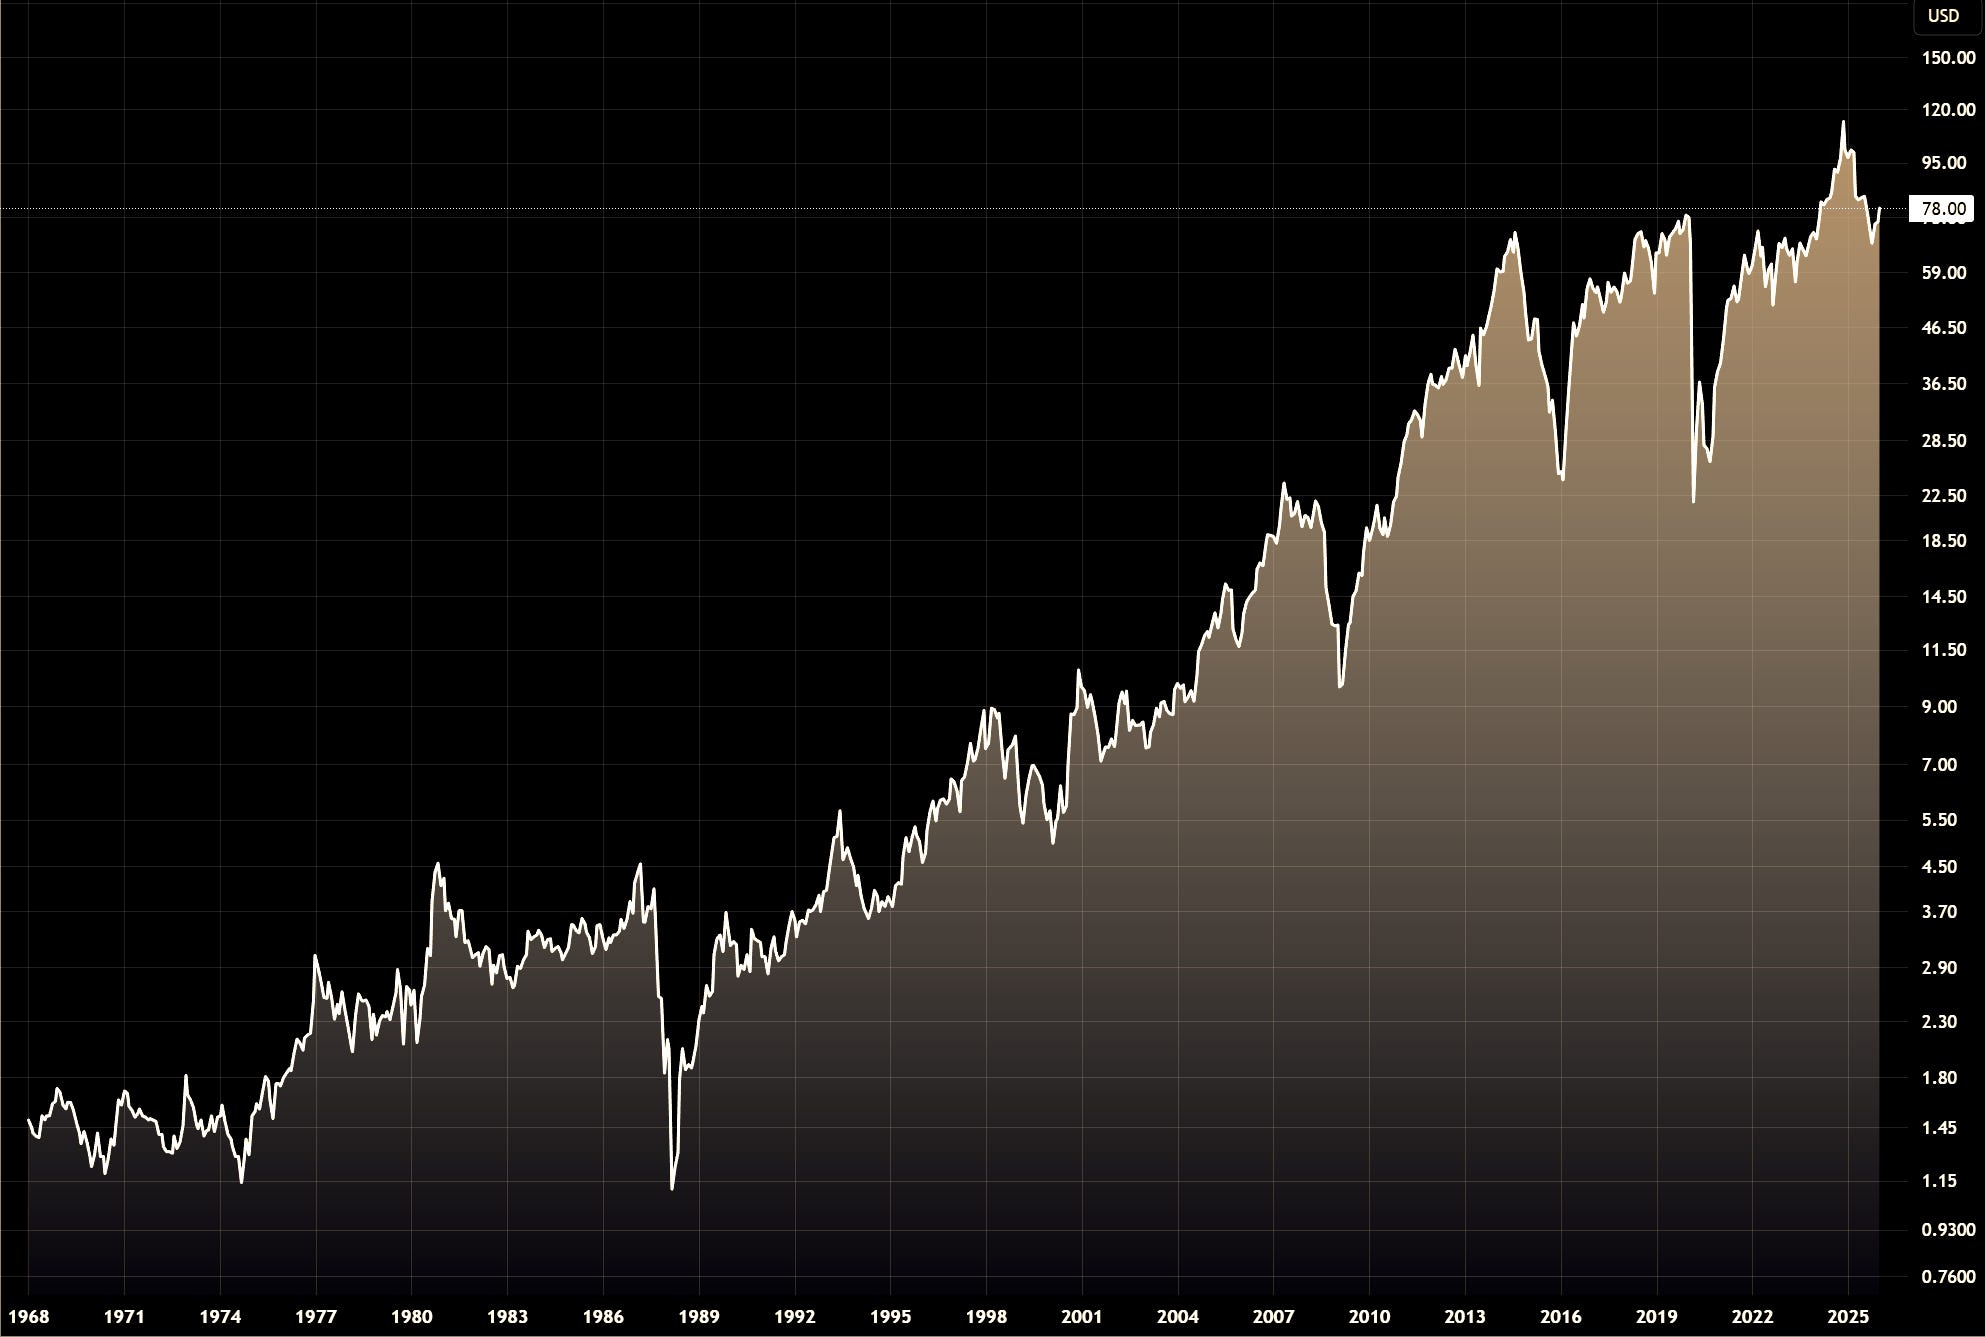
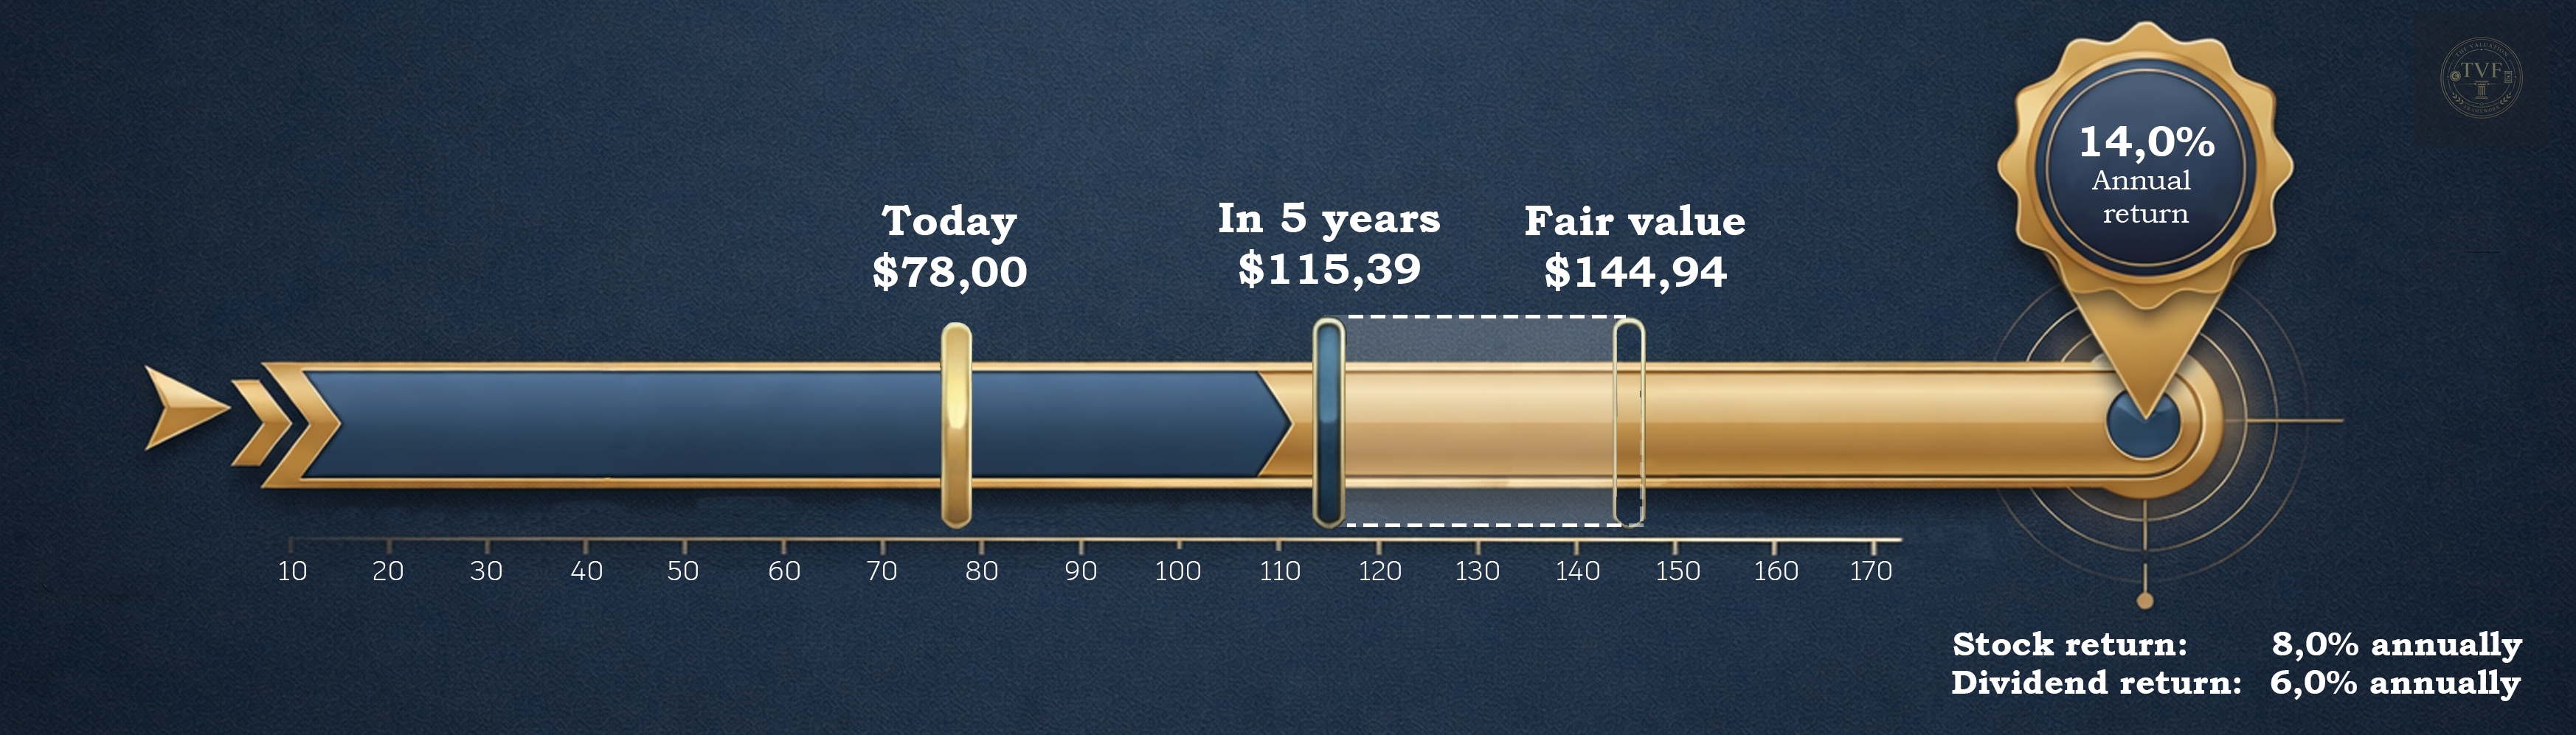
Today (price): $78.00
5-year price target: $115.39 — the model-implied market price in 2031 based on an exit P/E multiple.
DCF fair value: $144.94 — intrinsic value based on free cash flows (DCF), independent of what the market “wants to pay” in 2031.
Total return: 14.0% per year
Sanity checks
Implied EV/EBITDA: 11x → market-consistent for large, stable infrastructure players.
Implied P/E: 15x → consistent with normalized earnings and lower rates/leverage after deleveraging.
WACC / discount rate — 6.5% → stable fee-like cash flows and debt reduction lower risk and the cost of capital.
Terminal growth — 2.5% → fits a defensive infrastructure asset base with long life and high replacement value.
CHAPTER 7 — Rating
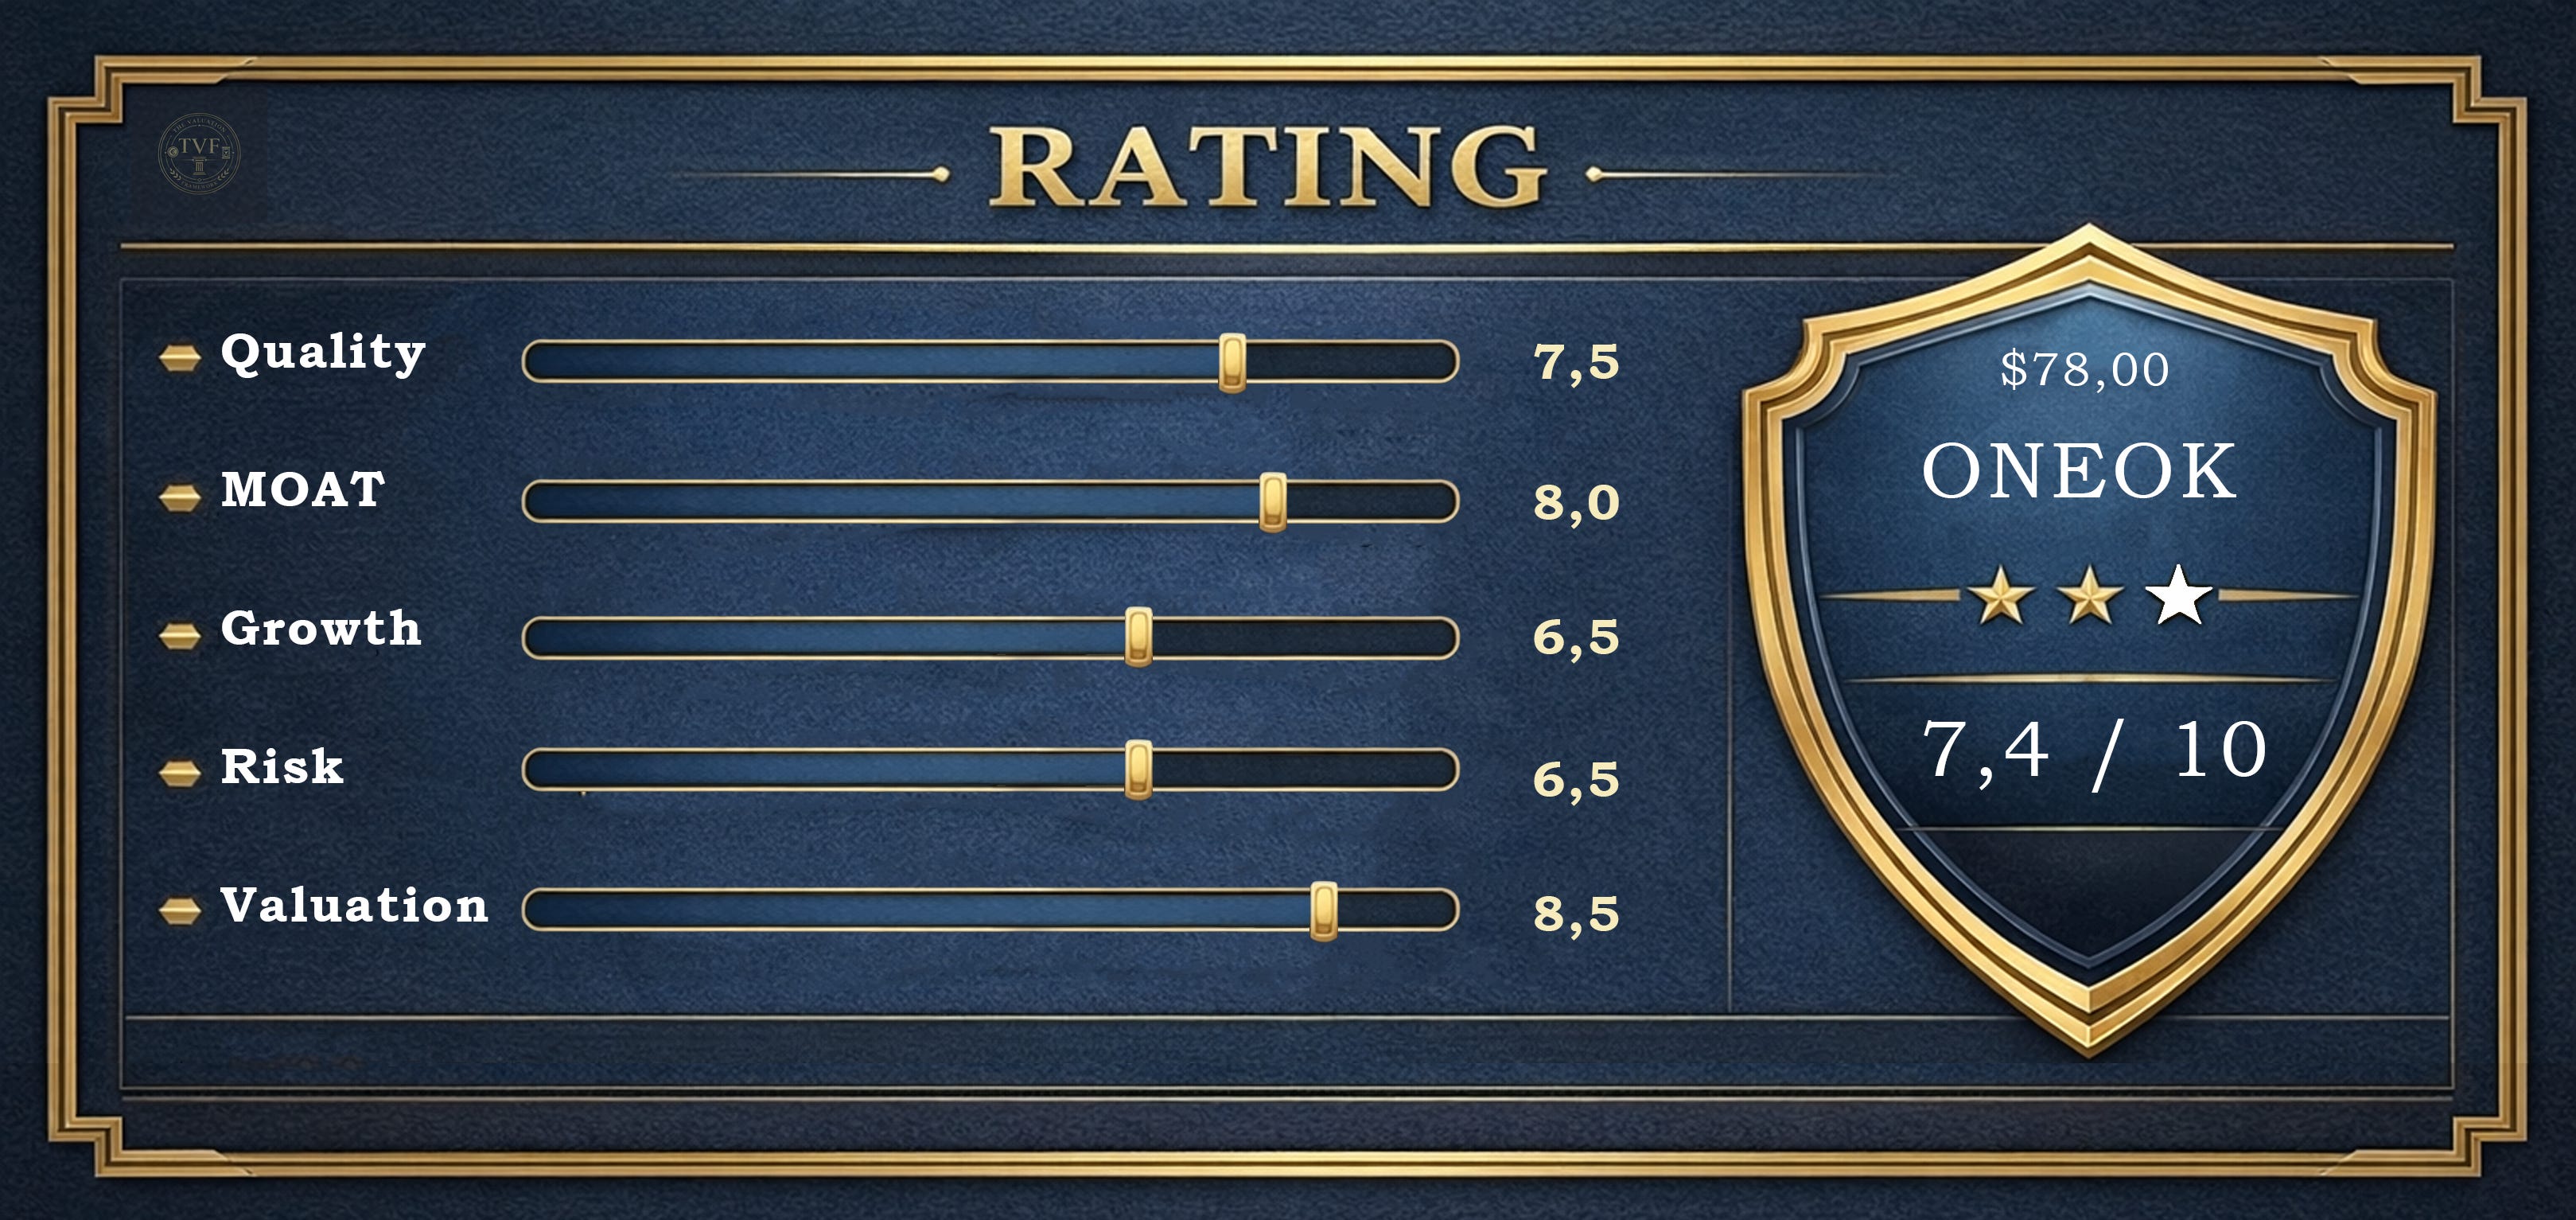
Quality — 7.5/10
Why this scores high
ONEOK is, at its core, a cash flow infrastructure business: much of its revenue is fee-/contract-driven, making cash flows more predictable than in upstream. That makes the company suitable for structural distributions (dividends and later buybacks) and gives the model a defensive character as long as volumes remain reasonably stable.
What caps the score
The recent acquisition wave has temporarily increased the risk profile: higher leverage, integration risk, and a period in which free cash flow is partly “reserved” for balance-sheet repair. In addition, midstream is inherently capital-intensive: maintenance and growth capex are not a footnote, but part of the business model. That prevents a “top rating” until the deleveraging path has been fully proven.
Bottom line
High quality within midstream due to predictable cash flows and discipline, but the score remains below 8+ because the case still leans on post-M&A execution and debt reduction.
MOAT — 8,0/10
Why this scores high
ONEOK’s moat is primarily structural: physical networks, hubs, and choke points that are extremely difficult to duplicate. In midstream, “competition” is rarely a new pipe next to the old one; it is more often a contest over route, permission, time, and existing customer dedications. The combination of (1) strategic hubs (processing/fractionation/storage/terminals), (2) right-of-way/permit friction, and (3) long-term contractual anchoring creates a defensive position that is strongest where capacity is scarce.
What caps the score
The moat is not “absolute pricing power”: parts are regulated or competitive on tariffs, and volumes remain dependent on upstream activity over time. The moat therefore protects cash flow stability and utilization more than “excess returns without capex.”
Bottom line
One of the stronger moats in midstream: hard to copy, high switching costs, and hubs that create optionality.
Growth — 6,5/10
Why this scores mid-to-high
The growth phase over the coming years is mainly integration + synergies + debottlenecking, not hyperscale. Growth comes from:
Synergy realization (commercial + cost) after Magellan/EnLink/Medallion
Utilization uplift: running existing infrastructure fuller, with low marginal capex for expansions
Export/industrial demand as a structural pull (NGL/LPG and gas/power/industrial)
What caps the score
This is not a company where revenue and earnings can “effortlessly” double without repeated heavy investment. Growth is cyclically sensitive via volumes, and part of the growth surge is one-off M&A-driven (thus later normalizing toward a sector-like pace).
Bottom line
A good near-term growth setup through synergies and scale, but it remains capital-intensive and normalizes toward a more utility-like growth profile.
Risk — 6,5/10
Top 3 risks
Leverage + refinancing path (high)
The core risks are not a bad week in oil prices, but the pace of deleveraging and the terms on which debt is rolled. If EBITDA/volumes underperform or rates remain high, buyback capacity shifts out and the equity story becomes “later, not now.”Integration & synergy realization (medium–high)
The investment case assumes that synergies and commercial optimization truly land. Any delay means: lower FCF per share, a longer period of higher leverage, and less room for capital return.Volume/throughput cycle (medium)
Fee-based dampens, but does not fully neutralize. In a structural volume contraction (Permian/Bakken), utilization falls—and utilization is the lever under the cash flow.
Bottom line
Risk is not existential, but path-dependent: the equity case stands or falls with execution (synergies + capex discipline) and the credit path.
Valuation — 8,5/10
Why this scores high
Based on our research, ONEOK is attractive because returns can come from three sources:
Cash return (dividends, later buybacks)
FCF per share growth (synergies + utilization + normalization)
Multiple/stress buffer if cash flows prove defensive
If the model points to ~14% annual total return (dividends + price appreciation) with a realistic deleveraging path, 8.5 is defensible within TVF: you are not paying for “perfection”; you get cash flow and optionality while the market is still pricing an integration/leverage phase.
Bottom line
An attractive price/return setup as long as execution (synergies + credit discipline) stays within range.
Conclusion — Would I invest?
ONEOK is, at its core, a midstream “toll booth”: a large, hard-to-copy infrastructure platform that primarily earns on volumes moving through the system, not on timing commodity prices. After the acquisition wave (Magellan/EnLink/Medallion), the company is at an inflection point: the heavy investment and integration phase now has to turn into a phase where free cash flow per share visibly grows and shareholder returns structurally increase.
Would I invest?
I would consider it as an income + compounding position under my framework, but only with conditions. This is not a “hypergrowth” story. The core thesis is: (1) the platform remains operationally robust, (2) cash flow normalizes and grows per share, and (3) management sticks to priorities: balance sheet first, then accelerating buybacks. If those three hold, the case is a combination of dividends, rising owner yield, and a reasonable path to per-share value creation. This is not a recommendation to buy, sell, or hold any security.
Disclaimer & disclosures: This analysis reflects the author’s opinion at the time of writing and is not investment advice. Investing involves risk, including the potential loss of principal. All valuation outputs (including DCF, target prices, expected returns) are model-based estimates and highly sensitive to assumptions (e.g., cash flow, leverage, capex, discount rate, and terminal growth). Facts may be derived from public sources believed to be reliable, but accuracy is not guaranteed.
Position/conflicts: Author does not hold a position in ONEOK (OKE). This may change at any time without notice.
Hey here. I ahve subbed. Let’s support each other and grow together. Check my last article on UBER here https://substack.com/@valueinvestorfromitaly/p-192010627